![]()
![]()
![]()
![]()
|
|
|
|
|
To search for profiling data within the selected view either right-click there and select Find from the popup menu, go to Edit>Find/Replace or press CTRL+F (Command+F on OS X). You will be prompted to the following dialog:
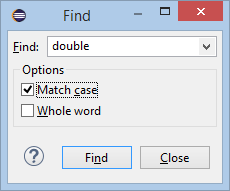
In the Find field, enter the key word to search for profiling data. The Match case option will search for entries containing the specified key word with the same case. The Whole word option will search for entries that match the specified key word entirely.
Click Find when ready. As a result, mBProfiler will search the profiling data downwards from the selected entry in the current view or from the first one if none is chosen.
In the views that contain trees (Memory Call Tree, Heap, etc), mBProfiler will search downwards all the subnodes of the selected node and continue to the node that follows. If there is no selected node, mBProfiler will start searching from the first one.
mBProfiler shows all the siblings of a matching element, regardless of the table tree children count limit, because of usability and performance issues.