To get a summary of the time periods in which the thread has been in different states;
Double-click on a thread from the table.
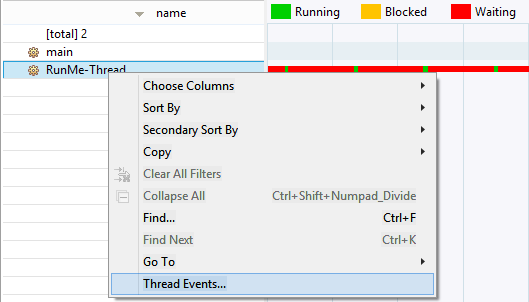
Right-click on the thread and select Thread Events from the popup menu.
Double -click the monitored graph on the right. In this case, the dialog will contain the events that are closest on the time scale.
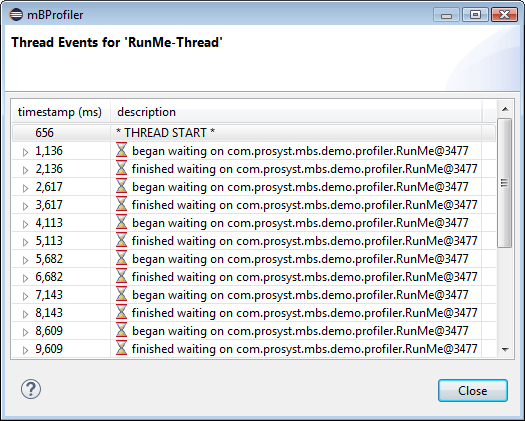
This table provides more information about the columns in the thread dialog.
Column
Description
timestamp (ms)
The time (in milliseconds) when the event has occurred.
description
The type of the event. When the node is unfolded, you can see the thread's stack trace where the event has occurred.
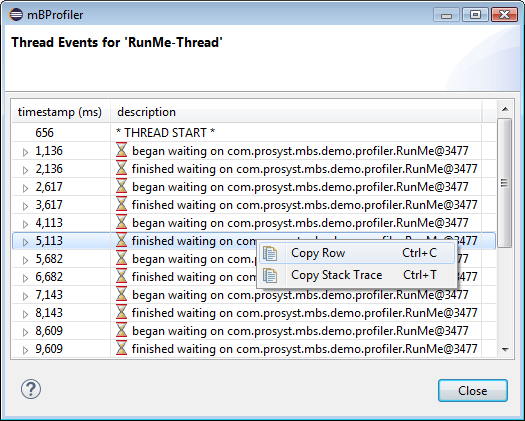
You can further copy the information from the dialog or view the source of the event:
To copy the information available in a node's row, right-click the node and use Copy Row.
To copy the associated stack trace, right-click the event root node and select Copy Stack Trace.
In case you have associated a project with the launched profile configuration, to quickly locate the Java code behind a stack frame, right-click the subnode and use Show Source.