![]()
![]()
![]()
![]()
|
|
|
|
|
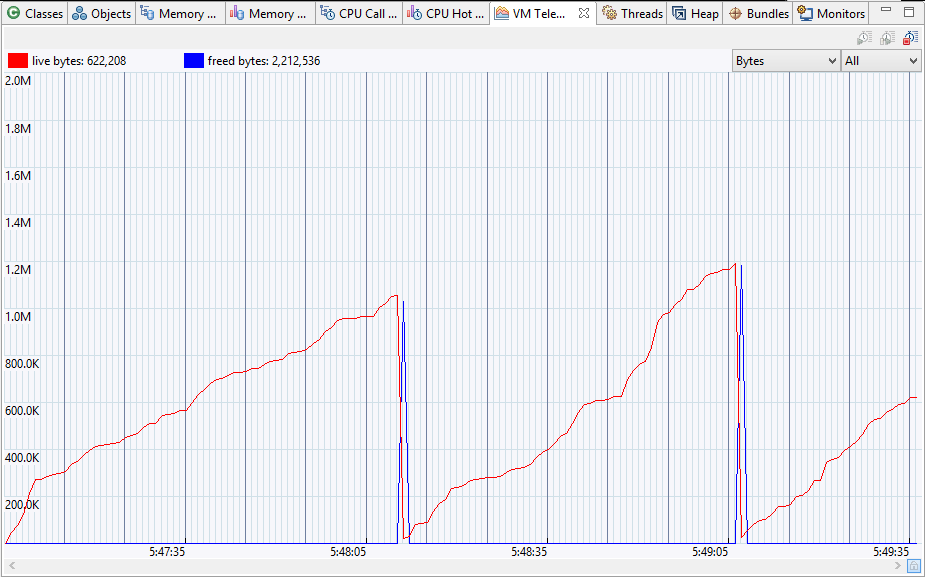
Statistics about the target JVM can be monitored in the VM Telemetry view. Line charts visually represent the progress in time of different JVM characteristics during the profiling process. The graphic represents different aspects of the performance depending on the settings of the filters in the upper right corner. The dimensions of the plot are constant for a particular setting and for identical readings. They are scaled in correspondence with the size of the window.
To have the VM Telemetry view show data, JVM profiling must be started as well as memory profiling for certain graphs.
Starting/Stopping JVM Profiling
JVM profiling can be initiated automatically when launching or connecting to the profiled application if you have checked the Auto start VM Telemetry session option in the profile configuration (refer to the Configuring General and Auto-Start Session Settings guide). If you don't check this option, you'll have to start the JVM profiling by calling Start VM Telemetry Session command from the mBProfiler menu or by pressing the ![]() button from the workbench toolbar. Another option is to use the
button from the workbench toolbar. Another option is to use the ![]() button from the toolbar of the VM Telemetry view.
button from the toolbar of the VM Telemetry view.
Click the ![]() toolbar button in the VM Telemetry view to stop the session. As a result, the view will end cumulating information.
toolbar button in the VM Telemetry view to stop the session. As a result, the view will end cumulating information.
At any time later, you can continue profiling by using the ![]() button from the view toolbar. This will add the current results from memory profiling to the results from the previous period.
button from the view toolbar. This will add the current results from memory profiling to the results from the previous period.
To restart the profiling, use mBProfiler >Start VM Telemetry Session or click the ![]() toolbar button from the view. This will clear the results from the previous session, and will start the calculation anew.
toolbar button from the view. This will clear the results from the previous session, and will start the calculation anew.
Changing the Time Range
You can use the scale filter to control the range of the horizontal time axis. The axis represents the elapsed run time and the visible interval shown in the window is controlled by the scale filter – correspondingly 1, 2, 5 minutes and All.
Time distribution of the information is drawn to a grid in which each partition shows the progress between two seconds. The samples are taken each second and plotted to the grid intersections.
JVM Graphs
mBProfiler provides a wide range of graphs presenting specific aspects of the JVM operation – Bytes, Instances, Array Bytes, Array Instances, Threads, Class Loaders, Classes, GC Activity and CPU Time. Refer to the next paragraphs for more information.
Switching between Graphs
Use the graph filter in the top right corner to define what kind of information about the JVM performance will be displayed.
According to the chosen graph type, the range of the vertical axis changes. The axis is also additionally scaled during cumulating information so as to fit the whole plot into the visible part of the window. At the top of the view, the total of the currently examined parameters is shown.
Bytes Graph
The Bytes graph visualises allocated bytes and the transitions in memory during garbage collection operations. The Bytes graph contains data only if memory profiling is started as well – see Starting/Stopping Memory Profiling.
There are three graphics in this mode – a red, a blue one and a green one.
Instances
This mode shows the number of instances that are currently created. The Instances graph contains data only if memory profiling is started as well – see Starting/Stopping Memory Profiling.
Like the Instances graph, this one also shows three graphics – a red, blue, and green one. Their meaning is related to the one for allocated bytes. This mode shows how many instances have been created, while the previous one shows what amount of memory they have consumed.
Array Bytes
The Array Bytes graph visualizes in red how many bytes are allocated for array instances and in blue – how many for objects of other types. The Array Bytes graph contains data only if memory profiling is started as well.
Array Instances
The Array Instances graph visualises in red the number of instances which are arrays and in blue the number of instances of other types. The Array Instances graph contains data only if memory profiling is started as well.
Threads
The Threads mode contains only one graphic – a blue one. It shows the total number of existing threads.
Class Loaders
The Class Loaders graphs shows the change in the number of class loaders that are engaged in the JVM process.
Classes
This mode shows in red the total number of classes loaded in the JVM at different stages of the program execution, and in blue – the number of unloaded ones.
GC Activity
The garbage collector (GL) graph shows the percentage of resources spared for GC operation during the period it has been active. For example, if the plot shows that the GC has worked 3 times 50ms each, then there will be 3 peaks of 5%. This summary is given above the graphic.
CPU Time
The CPU Time graph represents in percents and in milliseconds the workload of the CPU by the profiled application.