To debug the remote OSGi framework along with specific bundles from the workspace, follow the steps similarly to plain mode:
Make sure the JVM on the target device supports debugging.
Add some breakpoints to the code of the bundles you will test in the Eclipse workspace.
Open the remote OSGi framework launch configuration by using the Run > Debug Configurations menu option.
In the Bundles tab, make sure you have included the relevant bundles from the workspace and from the target platform.
To enable Eclipse to locate the Java code of a breakpoint within a bundle to be installed, go to the Source tab and add the relevant plugin project from the workspace.
Click the Debug button to trigger the debug session.
Confirm remote JVM restart.
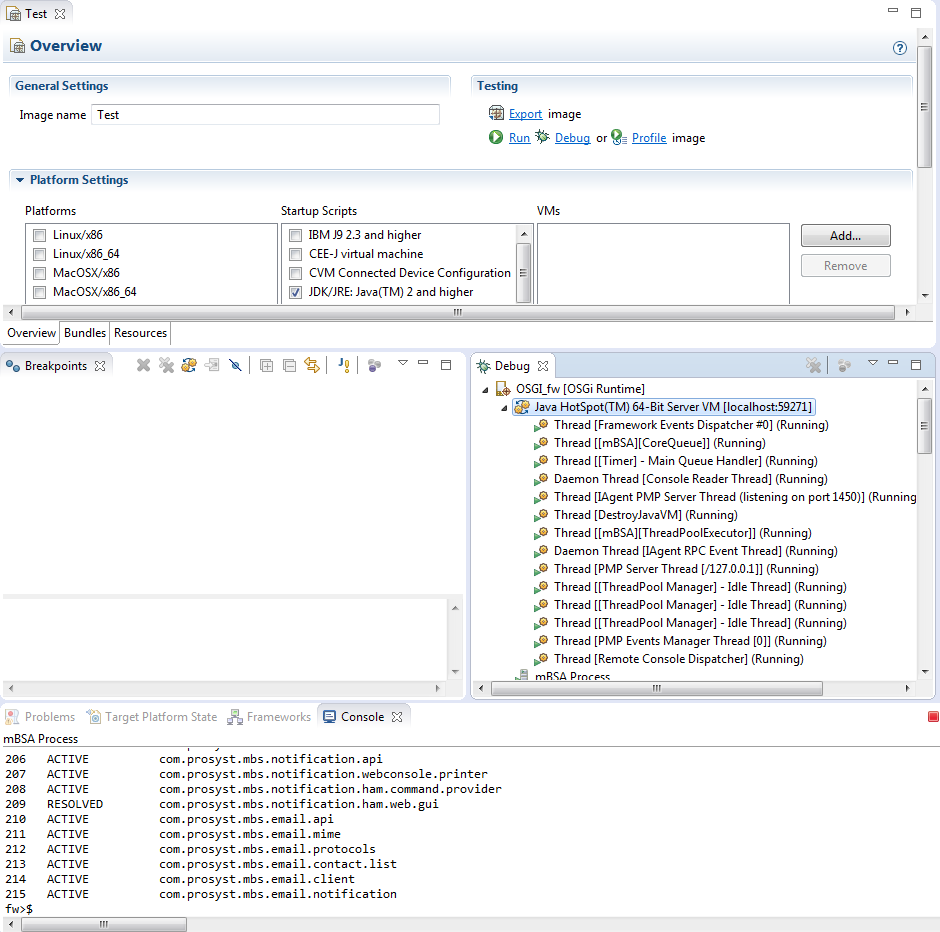
On success, the Debug perspective will be opened with the execution of the OSGi Runtime suspended at the first breakpoint in your code within Eclipse. The debug information will be communicated over default port 8000.