![]()
![]()
![]()
![]()
|
|
|
|
|
Launching in profiling mode will allow sending information about resource consumption in the JVM from the remote OSGi framework to Eclipse.
The information is conveniently shown in the friendly visual interface of the mBProfiler (if installed). Profiling will allow you to optimize the operation of their OSGi-aware application.
To profile an OSGi framework remotely, make sure the JVM on the target device supports profiling and there is a profiling agent in the platform.
To profile the remote OSGi framework along with specific bundles from the workspace, similarly to running it in plain mode as described in the previous section:
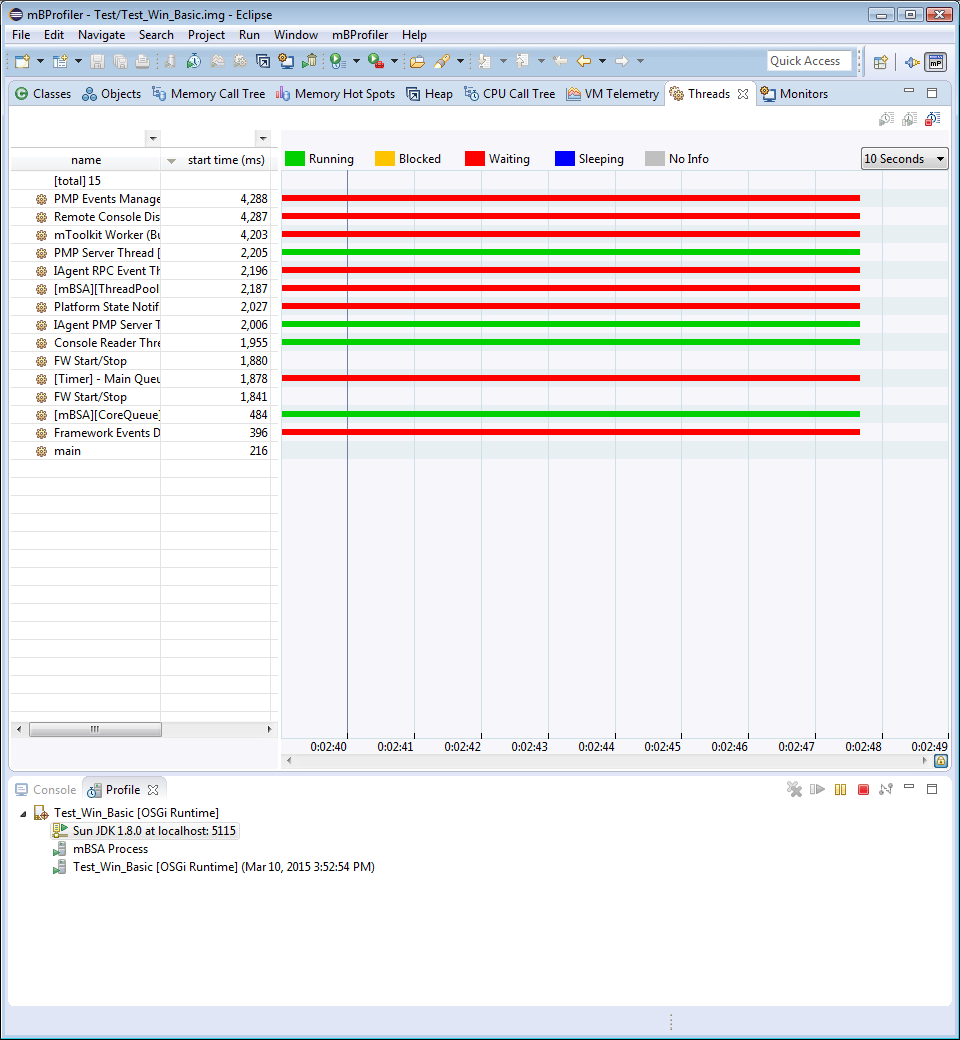
On success, the mBProfiler perspective will be opened with the profiling information being currently collected and displayed. The information will be communicated over default port 5115 as shown below.