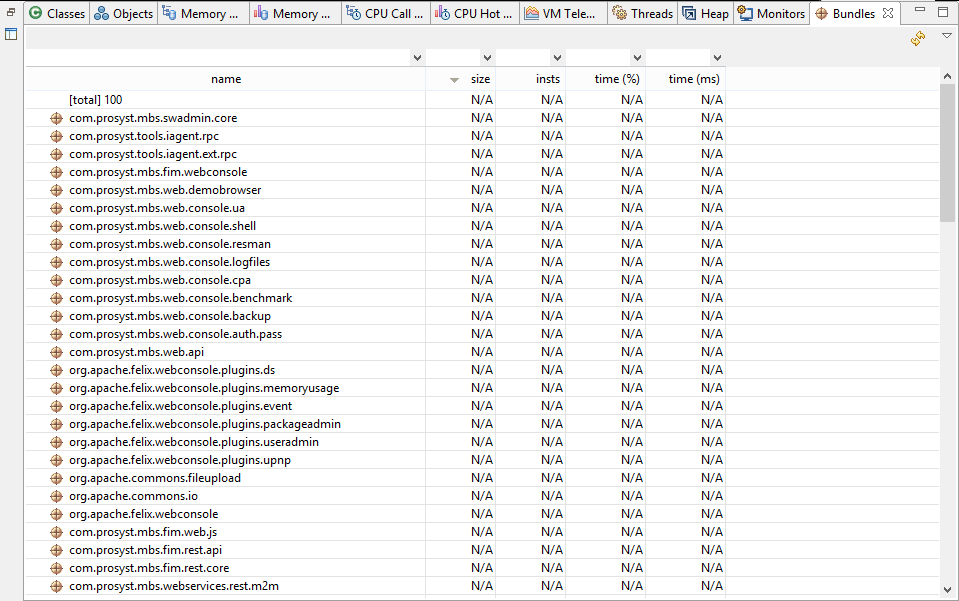
To view general performance information about the bundles in the OSGi runtime, open the Bundles view in the mBProfiler perspective by clicking Window > Show View > Bundles from the main menu bar. The view shows a table of bundles, represented by symbolic name, and summarized profiling data collected about them. To refresh the information about the bundles on the runtime, use the button.
For each bundle installed in the OSGi Runtime, you can check:
Memory usage
The amount in bytes of consumed memory in the size cell.
In the insts cell the number of objects that the bundle has created.
Meaningful information about consumed memory and created objects amount, shown in the size and insts columns, is available for a certain measured time period. Otherwise, you will see N/A in the columns.
To retrieve this data you must have:
First, turned on memory profiling upon connecting mBProfiler to the OSGi Runtime or during the profiling process by clicking the Start Memory Profiling command from the mBProfiler menu or by pressing the toolbar button from a memory view, such as Bundles Memory Call Tree, Memory Call Tree, Classes, Objects, or Memory Hot Spots.
And then stopped the OSGi memory profiling from some of the above views after a key moment during the runtime execution has passed.
CPU usage
The percents of CPU time in the time (%) cell.
CPU usage in milliseconds in the time (ms) cell.
Meaningful information about CPU usage, shown in the time (%) and time (ms) columns, is available for a certain measured time period. Otherwise, you will see N/A in the columns.
To retrieve this data you must have:
First, turned on CPU profiling upon connection mBProfiler to the OSGi Runtime and during the profiling process by clicking the Start CPU Profiling command from the mBProfiler menu or by pressing the toolbar button from a CPU view, such as Bundles CPU Call Tree, CPU Call Tree, or CPU Hot Spots.
And then stopped the OSGi CPU profiling from some of the above views after a key moment during the runtime execution has passed.
For precise location of potential problematic bundles, use the filter fields at the top of each column.
Getting Information about a Bundle's Consumption
mBProfiler offers an easy way to locate the resources used by one or more selected bundles in the Bundles view. In particular, you can easily view:
The call tree of all methods of the selected bundles which have consumed CPU time and memory:
To examine the duration of the bundles methods within the call stacks of related threads, right-click on the bundles and select from the pop-up menu:
Go to > Filter CPU Call Tree to open the CPU Call Tree view which will show the CPU consumption down the call tree.
Go to > Filter CPU Hot Spots to open the CPU Host Spots view which will display the backtraces of method calls made by the bundle and the CPU time consumption of each call.
To analyze the memory for execution of the bundles methods within the call stacks of related threads, right-click on the bundles and select from the pop-up menu:
Go to > Filter Memory Call Tree from the pop-up menu to switch to the Memory Call Tree view which will show the memory consumption down the call tree.
Go to > Filter Memory Hot Spots from the pop-up menu to open the Memory Host Spots view which will be display the backtraces of method calls made by the bundles and the memory consumption of each call.
The call tree of all objects created by the selected bundles. Right-click on the bundles and select Go to > Filter Objects from the pop-up menu. The Objects view will be opened with information about the memory size allocated by the bundles objects.