![]()
![]()
![]()
![]()
|
|
|
|
|
mBProfiler presents the memory consumption of the bundles within the connected OSGi Runtime in the Bundles Memory Call Tree views. Data is shown in a similar way to the Memory Call Tree view but here the participants within the thread call stacks are bundles. In this way, the calls among the bundles in terms of memory usage stand out clearly.
The Bundles Memory Call Tree view is not shown by default when loading mBProfiler in Eclipse. You can open the view by clicking Window > Show View > Bundles Memory Call Tree from the main menu bar in the mBProfiler perspective.
To have data shown, memory profiling must be turned on and the session must be stopped – either from this view or from another one related to memory: Memory Call Tree, Classes, Objects or Memory Hot Spots.
Starting/Stopping Bundle Memory Profiling
Bundle memory profiling can be initiated automatically when connecting to the OSGi Runtime if you have checked the Auto start Memory session option in the profile configuration (see the Configuring General and Auto-Start Session Settings document). If you don't check this option, you'll have to start the memory profiling by calling Start Memory Profiling command from the mBProfiler menu, by pressing the ![]() button from the workbench toolbar or use the
button from the workbench toolbar or use the ![]() one from the view toolbar.
one from the view toolbar.
Click the ![]() toolbar button to stop the session and have the results from memory consumption profiling finally calculated and displayed. As a result, the Bundles Memory Call Tree view will show statistical data about the performance of the bundles in the OSGi Runtime.
toolbar button to stop the session and have the results from memory consumption profiling finally calculated and displayed. As a result, the Bundles Memory Call Tree view will show statistical data about the performance of the bundles in the OSGi Runtime.
At any time later, you can continue profiling by using the ![]() button from the view toolbar. This will add the current results from memory profiling to the results from the previous period.
button from the view toolbar. This will add the current results from memory profiling to the results from the previous period.
To restart the profiling, use mBProfiler > Start Memory Session or click the ![]() view toolbar button. This will clear the results from the previous session, and will start the calculation anew.
view toolbar button. This will clear the results from the previous session, and will start the calculation anew.
Stopping/Resuming the session in the Memory Call Tree, Classes, Objects or Memory Hot Spots view will reflect to the Bundles Memory Call Tree and vice versa.
Memory Tree
The memory tree in the Bundles Memory Call Tree view is similar to the one available in the Memory Call Tree one. However, this view shows relations between bundles instead of between frames and methods, and hence:
Memory Table and Filters
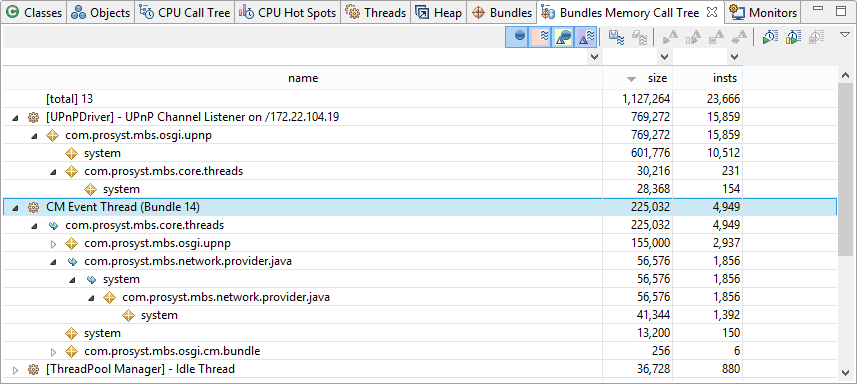
Generally, the data about bundle memory usage during the past period is shown in tabular form. For thread root nodes, naturally the name column shows the thread name, the size one displays the amount of the memory thread has engaged, and the insts one contains the number of objects the thread has created. For bundle nodes, the name column contains the symbolic name of the corresponding bundle, the size one indicates the total memory the bundle has used to execute the call, and the insts one presents the number of objects generated by the bundle.
You can also filter the information shown in the table so that you can locate spots of specific consumption.
In addition, you can sort conveniently bundle memory data as described in the Table Sorting section.
Getting Information about the Methods in a Caller Path
To locate the actual method calls behind a chain of bundles within the call stack, right-click the relevant entry in the chain from the table and select Go to > Filter Memory Call Tree. As a result, mBProfiler will switch to the Memory Call Tree view showing all call traces within this execution path.
For example, if you have selected the node bundle A -> bundle B -> bundle C in the Bundles Memory Call Tree, using the Go to > Filter Memory Call Tree command will result in opening Memory Call Tree with all method invocations and frames sharing the same loader path, that is, methods/frames forming one of the paths (bundle A)*L -> (bundle B)*M -> (bundle C)*N. There you can get detailed information about each method's memory usage.
You can also apply this operation on a thread root node as well. In this case, mBProfiler will locate the analogous root sub-tree in the Memory Call Tree view.
Getting Information about the Activity of a Thread
To easily get runtime information about the activity of a thread from the Bundles Memory Call Tree view, right-click the thread root node of interest and select Go to > Find in Threads. mBProfiler will switch you to Threads view with the information about the target thread highlighted. The Threads view will offer details about the activity events of the thread.
Getting a Summary of a Bundle's Performance
Having detected a bundle with interesting performance, you can view its performance summary in the Bundles view right away. Thus, you can quickly check the bundle's total memory consumption.
Right-click the bundle entry in the execution stack and select Go to > Find in Bundles. Refer to the General Bundle Performance Data guide for more details on the Bundles view features.