Configuring General and Auto-Start Session Settings
To open the collection of profile launch configurations for running certain applications in profiling mode, use the Run > Profile Configurations menu command or select Profile Configurations from the button pull-down menu.
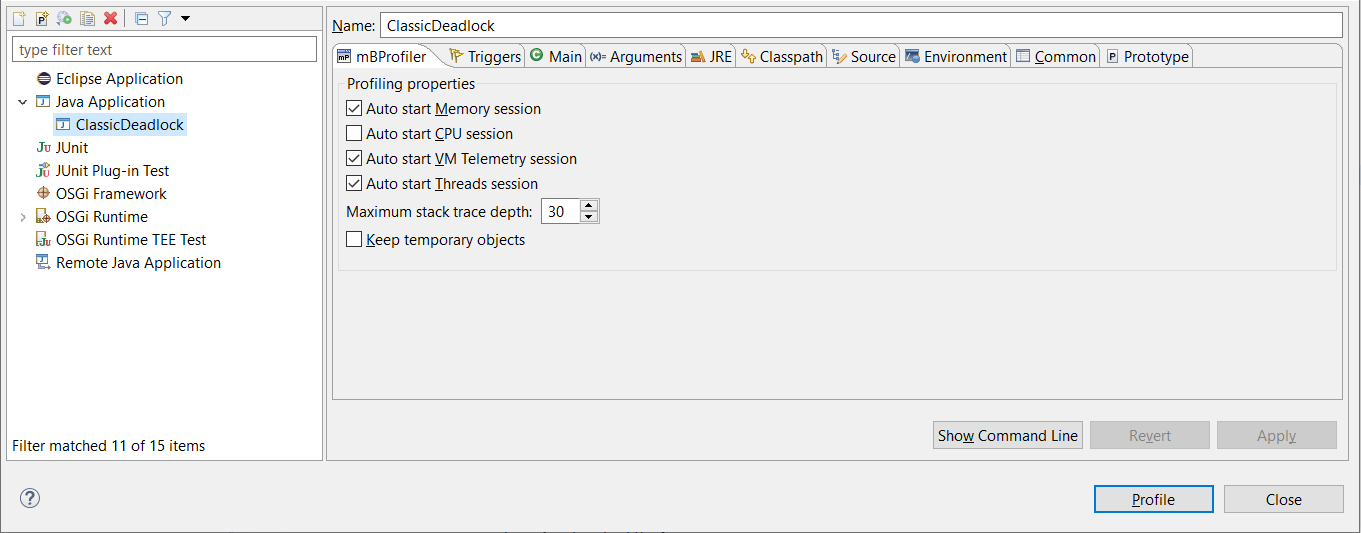
The profiling sessions to start upon application launch along with some general settings are listed in the mBProfiler tab of a profile launch configuration. Select the sessions you need for an application's performance analysis.
Auto start Memory session – Enables the automatic startup of the memory profiling when mBProfiler connects to the target application which is being profiled.
Auto start CPU session – Enables the automatic startup of the CPU profiling when mBProfiler connects to the target application which is being profiled.
Auto start VM Telemetry session – Enables the automatic startup of the VM telemetry session.
Auto start Threads session – Enables the automatic startup of the threads profiling session.
The other general properties related to the profiling process are:
Maximum stack trace depth – Defines the number of stack frames that will be displayed in the memory tree. Reducing this number saves time and memory both on the frontend side and on the side running the target JVM and the agent.
Keep temporary objects – Enables keeping temporary objects during the profiling session. As they are usually cleaned by the JVM's garbage collector, this option is useful to track down if the application creates too many objects of this kind thus increasing the load on the system.
To save the configuration properties, click the Apply button.