mBProfiler triggers allow you to start a profiling action when a specific event occurs within the body of a class method. Thus, you can perform precise analysis of the operations and on the objects you are particularly interested in.
The combination of a class, its method(s), the event that triggers a profiling action and the action is called a trigger. You can specify which triggers will be used for each mBProfiler process via the relevant profile configuration. To open the collection of profile launch configurations for running different applications in profiling mode, use the Run > Profile Configurations menu command or select Profile Configurations from the button pull-down menu.
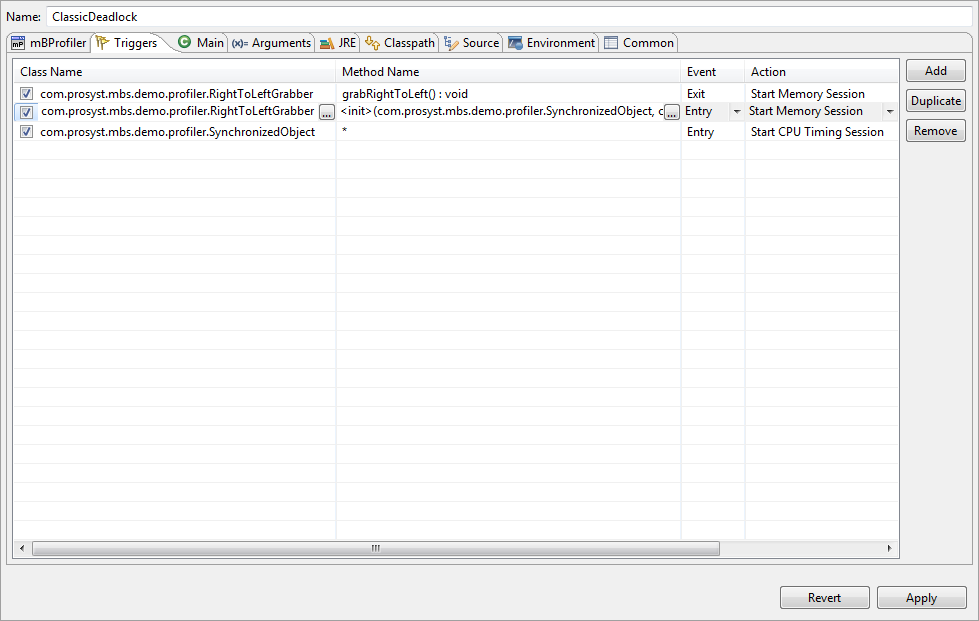
To define and change the set of triggers for the profiler application, select the target configuration and go to its Triggers tab.
To create a new trigger:
Click Add.
Set the attribute of the trigger:
Class Name – Contains the name of the trigger class. Click the browse (...) button to locate easily the class in the project assigned in the Main configuration tab, or if a project is not specified – in the workspace. You might also type the fully qualified name of the class.
Method Name – Contains the name or signature of the class's method the event in whose body will trigger the specified profiling action.
By default Method Name is an asterisk *, which means that the trigger will be activated in any method within the corresponding class.
To specify the name or the signature of a real method for the trigger, click on the Method Name cell and use the browse (...) button to easily locate the method.
Event – Contains the method event that will launch the trigger's action. Click on the Event cell to activate the box and select Entry or Exit.
The trigger will be actuated at the beginning (Entry) or at the end (Exit) of the defined scope – a single method or all methods.
Action – Contains the most important setting for the trigger. It defines what kind of action will be started when the point, specified by the previous three cells, is reached. Similar results from each action might be realised by using some of the control manual commands at the exact time, but in most cases this is not practically achievable.
Start/Continue/End Memory Session – Actions related to controlling a memory profiling session.
Start/Continue/End CPU Sampling Session – Actions related to controlling a CPU profiling session using the sampling method.
Start/Continue/End CPU Timing Session – Actions related to controlling a CPU profiling session using the timing method.
Start/Continue/End Threads Session – Actions related to controlling a threads profiling session.
Start/Continue/End VM Telemetry Session – Actions related to controlling a VM telemetry profiling session.
Heap Snapshot – Action to take heap snapshots.
Monitors Snapshot – Action to take a monitors snapshot.
Start/Continue/End/Reset Memory Mark – Actions related to controlling a memory mark.
Export Data/Export Data as Text/Export Data as XML – Actions to export the collected profiling data.
Suspend Profiling – Action to suspend all profiling sessions.
Stop Profiling – Action to terminate or suspend all profiling sessions.
Run Garbage Collector – Action to run the garbage collector.
According to your requirements, select the Enabled checkbox in front of the relevant trigger to include in the subsequent profiling process. Thus, you will disable certain triggers but save the settings for future use.
To remove a trigger, select the trigger row and use the Remove button.
To save the configuration changes, click the Apply button.