![]()
![]()
![]()
![]()
|
|
|
|
|
The CPU Hot Spots view is not shown by default when launching mBProfiler in Eclipse. You can open the view by clicking Window > Show View > CPU Hot Spots from the main menu bar in the mBProfiler perspective.
To have data shown, CPU profiling must be turned on and the session must be stopped – either from this view or from CPU Call Tree.
Method calls or stack frames that consume less than 1 ms of CPU time, which mBProfiler treats as 0ms, are not shown as root entries in CPU Hot Spots as they not considered as "hot".
Call Backtraces
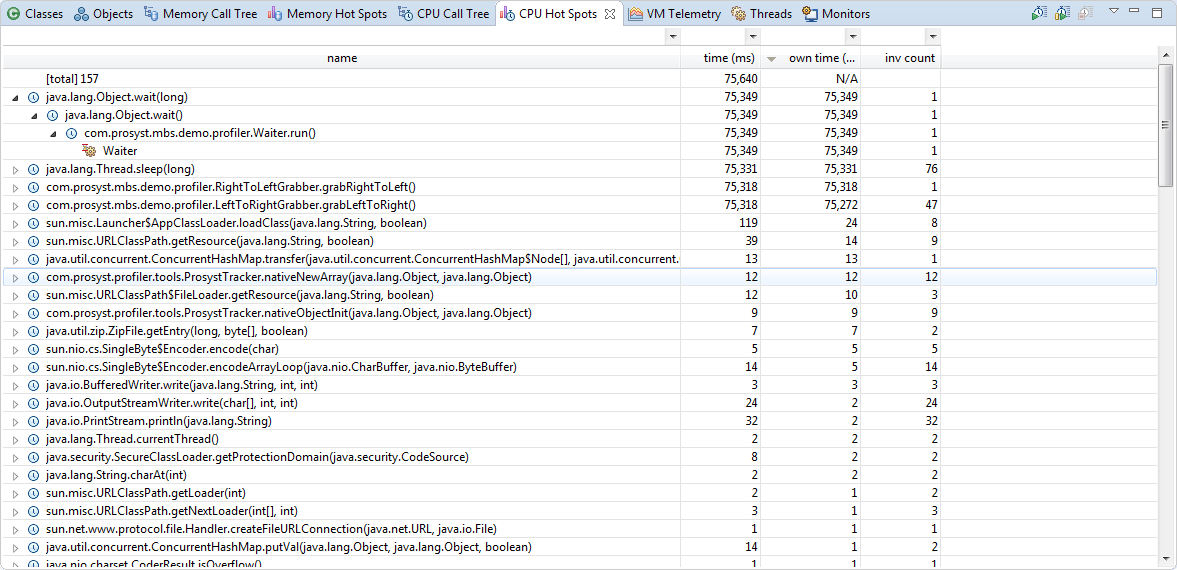
For each method execution, the CPU Hot Spots view shows the trace back to the originating thread, that is, in each method sub-tree the caller is a child of the callee. The tree nodes are similar to the CPU Call Tree ones but with reverse meaning.
Node |
Icon |
Description |
|---|---|---|
CPU Usage |
|
Stack frame or method whose components are consuming CPU time. |
Follow Backtrace |
|
These nodes show calls that do not load the CPU, but make other calls that do, or their duration is 0 ms. |
Thread |
|
Each thread ends a sub-tree representing a method backtrace. Thread nodes give information about the thread name, the amount of CPU time reflecting the associated hot spot measurements and the number of invocations of the thread. |
|
|
Use real CPU time is on |
|
|
All available threads are displayed with the same icon if the Use real CPU time option is enabled from the view pull-down menu or in the mBProfiler preferences (refer to Customising mBProfiler). |
|
|
Use real CPU time is off |
Active thread |
|
Currently active thread if it's run time is greater than 0,5s. To have thread durations calculated and respectively their state differentiated visually, make sure that thread profiling is active. |
Non-active thread |
|
Blocked, sleeping or waiting thread. |
For further details on the tree, refer to the CPU Call Tree guide.
If the profiler agent does not support real CPU profiling, trying to turn this features on will result in an error: "Real CPU is not supported for this platform"
CPU Table and Filters
The CPU profiling information is displayed in a table, whose columns can be added and removed using the Change Columns option from the pop-up menu or from the Preferences page. Go to Window >Preferences (or Eclipse >Preferences if you are using OS X) and then to mBProfiler > Columns. The table columns contain similar information about a method as the ones in the CPU Call Tree view. In this case, an inv count cell shows how many times the hot spot is called by the relevant stack frame or method.
You can also filter the information shown in the table so that you can locate spots of specific consumption.
In addition, you can sort conveniently CPU profiling data as described in the CPU Table guide.
Getting information about the Activity of a Thread
To easily get runtime information about the activity of a thread from the CPU Hot Spots view, right-click the thread node of interest at the bottom of the backtrace and select Go to > Find in Threads. mBProfiler will switch you to the Threads view with the information about the target thread highlighted. The Threads view will offer details about the activity events of the thread.
Locating the Call Stack of a Thread
To quickly locate the top-to-bottom call stack of a thread from the CPU Hot Spots view, right-click the thread node of interest at the bottom of the backtrace and select Go to > Find in CPU Call Tree. The CPU Call Tree view will open with the thread root node high-lighted.
If you are profiling an OSGi runtime, by using the Go to > Find in Bundles CPU Call Tree you can quickly switch to the Bundles CPU Call Tree view and locate the thread's call stack with regard to the participant bundles.
Getting the Memory Consumed by a Hot Spot
To examine the hot spot with regard to memory usage, right-click the line within the relevant call stack and select Go to > Find In Memory Hot Spots. The Memory Hot Spots view will show up with the entry selected in the relevant backtrace.
Excluding Method Calls from Results
By means of exclude method filters the CPU Hot Spots view supports narrowing the amount of profiling data so that only most useful information remains visible. The options to introduce and apply such filters are the same as in the CPU Call Tree view.