![]()
![]()
![]()
![]()
|
|
|
|
|
With the sampling method, mBProfiler records at a specified period of time the call traces of the threads of the executed application. The sampling method is recommended for large applications working for a long period of time (such as servers).
The advantage of this method is that it is much more scalable than the timing one. The sampler can also detect performance bottlenecks within methods because it is not based on method invocations. The disadvantage of this profiling technique is that it is less precise than the timing one, and does not record the number of method calls.
Turn Sampling On
To set up the sampling method to be your way for collecting CPU profiling information:
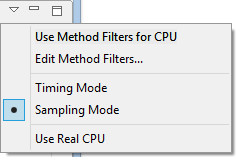
or
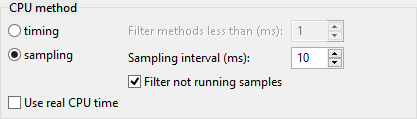
Next to the sampling option, in the Sampling interval text field if needed change the period of time for taking samples.
If this setting is changed after the CPU profiling has already begun, it will take effect the next time you start profiling.
You can additionally configure CPU profiling on top of the sampling method by using the following options:
If the profiler agent does not support real CPU profiling, the mBProfiler will show an error in the CPU Call Tree view:
"Real CPU profiling is not supported for this platform"