![]()
![]()
![]()
![]()
|
|
|
|
|
With the timing method, mBProfiler records the precise number of times each method of the executed application is invoked, and the time duration of each method execution.
The CPU timing method is recommended for use with applications that execute very briefly (within milliseconds) or have many threads serving small requests (such as servlet applications). The advantage of this method is that it is very precise. The disadvantages, however, are that it slows down considerably the tested application, and that it is not scalable and cannot be used for long time running applications. The considerable slow down can lead to distortion of the collected information. This slow down is due to the fact that this profiler runs in the tested application's threads and all method calls are slower.
Timing mode is not available for some JVMs.
Turn Timing On
To s up the timing method to be your way for collecting CPU profiling information:
or
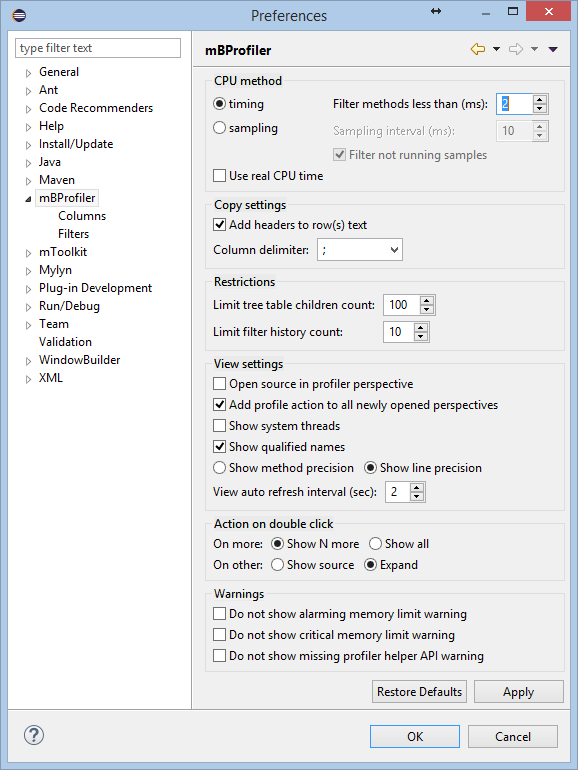
Next to the timing option, use the Filter methods less than field if needed to see only methods/stack frames whose duration is greater than certain execution time (in milliseconds).
If you change this setting after the CPU profiling has already begun, the new setting will take effect the next time you start profiling.
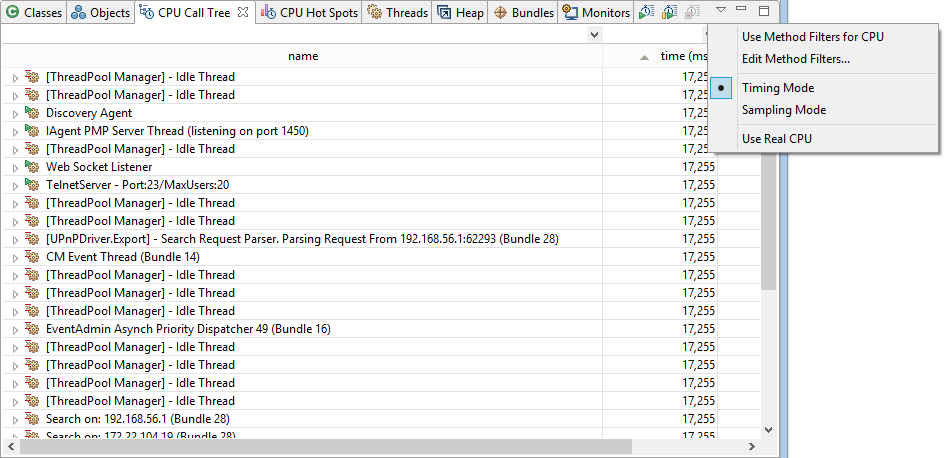
Together with the timing method you can use the Use real CPU time option, available in the mBProfiler preferences and in the pull-down menu of the CPU Call Tree view. The option defines if mBProfiler will show the real time of the CPU usage, or the total execution time of the tested thread/method. For example, let's have a thread that was started at 1:30 PM and stopped at 2:30 PM. However, the thread wasn't active all the time but was active (did some work and caused CPU usage) for a total of 5 minutes. If the Use real CPU time option is not checked, mBProfiler will show a whole 1 hour of work for the tested thread. If that option is checked, however, mBProfiler will show only 5 minutes of work for the thread.
If the profiler agent does not support real CPU profiling, the mBProfiler will show an error in the CPU Call Tree view:
"Real CPU profiling is not supported for this platform"
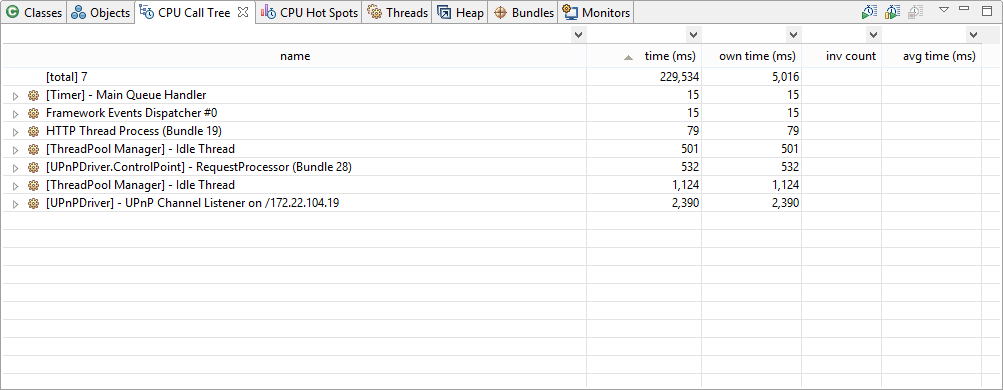
Without the Use real CPU time option
The figure below shows the CPU tree when the timing CPU method is used, and the Use real CPU time option is not active.
With the Use real CPU time option
The figure below shows the CPU tree when the timing CPU method is chosen, and the Use real CPU time option is active.