![]()
![]()
![]()
![]()
|
|
|
|
|
The Deadlock demo represents a typical deadlock of threads over common object monitors, which can be successfully tracked down by using the features of profiler.
Starting the Deadlock Demo
To start the demo in profiling mode:
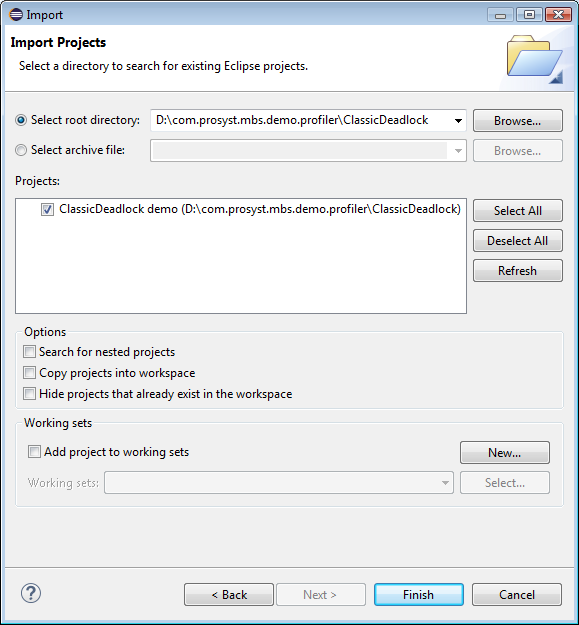
On success, the demo project ClassicDeadlock demo will appear in the Package Explorer view.
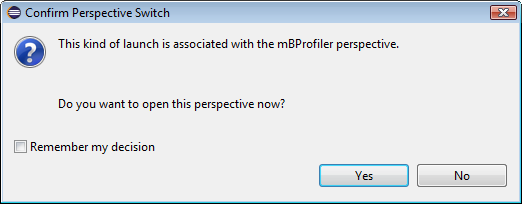
As a result, the Deadlock demo will be started based the predefined profile launch configuration.
This quick startup will not include auto-start of CPU profiling – to have this profiling information gathered, use the ![]() button from the CPU Call Tree or CPU Hot Spots view.
button from the CPU Call Tree or CPU Hot Spots view.
You can also run the demo with additional settings such as a different JVM, command line arguments, etc. in the demo's profile launch configuration accessible with the Run > Profile Configurations menu command. Refer to the Starting Local Profiling guide for more details.
Profiling the Demo with mBProfiler
When the demo is started, its ClassicDeadlock instance creates two threads, LeftToRight and RightToLeft. During execution, each thread locks its own monitor and tries to do the same with the one of the other thread by means of a synchronized method. Hence, shortly after the startup, a deadlock emerges. During profiling, you can use mBProfiler to easily detect such thread conflicts.
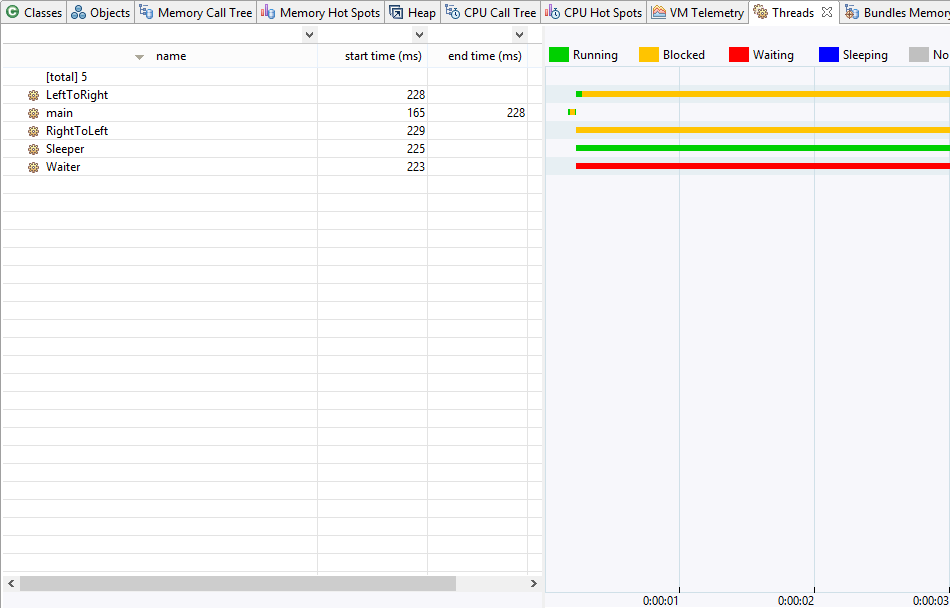
First, let's inspect the state of the LeftToRight and RightToLeft threads visualized in the Threads view. There, it is indicated that the two threads after running awhile have blocked.
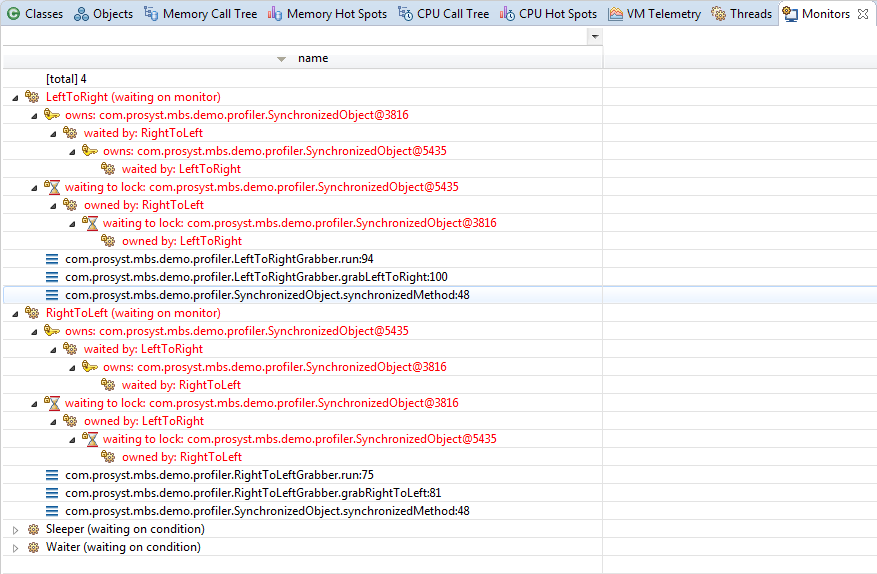
In case you have taken a snapshot of the thread monitors within the applications (mBProfiler > View Monitors Snapshot during profiling) , in the Monitors view you can also examine closely which are the conflict objects (painted in red) and the calls that have led to the deadlock.