![]()
![]()
![]()
![]()
|
|
|
|
|
The RunMe demo is explicitly created to show the major capabilities of mBProfiler. That's why it contains methods to slow down program execution and produce problematic code areas. With the help of mBProfiler we can detect these spots, where too much memory is consumed or too much time is required and thus we will be able to improve the application's performance.
Starting the Demo in Profiling Mode
To start the demo in profiling mode:
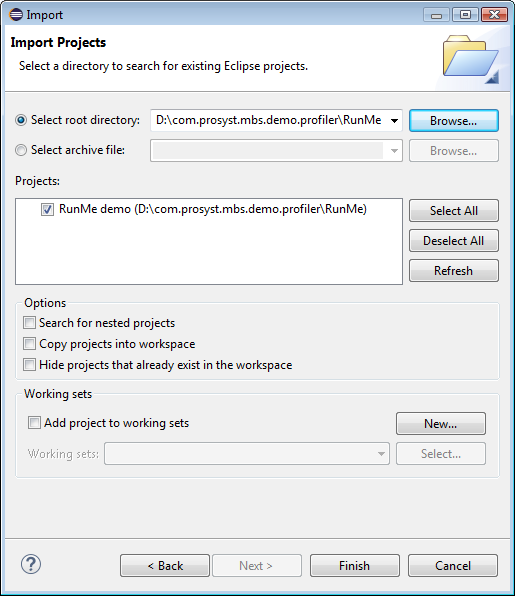
On success, the demo project RunMe demo will appear in the Package Explorer view.
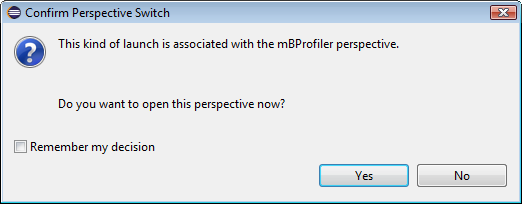
As a result, the RunMe demo will be started based on the predefined profile launch configuration.
This quick startup will not include auto-start of CPU profiling – to have this profiling information gathered, use the ![]() button from the CPU Call Tree or CPU Hot Spots view.
button from the CPU Call Tree or CPU Hot Spots view.
You can also run the demo with additional settings such as a different JVM, command line arguments, etc. in the demo's profile launch configuration accessible with the Run > Profile Configurations menu command. Refer to the Starting Local Profiling guide for more details.
Profiling the Demo with mBProfiler
During the profiling process the buttons Start CPU Session (![]() ), View Heap Snapshot (
), View Heap Snapshot (![]() ), View Monitors Snapshot (
), View Monitors Snapshot (![]() ) and Run Garbage Collector (
) and Run Garbage Collector (![]() ) on the workbench toolbar are active because by default the demo is started with the memory, threads and VM telemetry sessions turned on. Additionally, from a memory view (Classes, Objects, Memory Call Tree, Memory Hot Spots) you can mark a period of time of the program run, end profiling to have results calculated, etc.
) on the workbench toolbar are active because by default the demo is started with the memory, threads and VM telemetry sessions turned on. Additionally, from a memory view (Classes, Objects, Memory Call Tree, Memory Hot Spots) you can mark a period of time of the program run, end profiling to have results calculated, etc.
The output that the RunMe profiled class will usually print to the standard output is shown in the Console view.
The RunMe class checks for input arguments and if there are any, prints the first one of them to the Console view preceded by a "Hello". If there are no arguments, it just says "Hello, World!". After that some more informative output is produced, like the properties of the system preceded by their keys.
The RunMe class runs a thread, called RunMe-Thread, which performs all the other work. This thread is represented by a separate branch in the profiling tree views (Memory Call Tree and CPU Call Tree). All of the instantiations and method calls made during the life cycle of the thread are placed under its root node. The views also display the bytes that have been used during runtime and the number of instantiations.

The test class defines several basic operations that are executed in the run method of RunMe-Thread:
Memory Consumption Analysis
Memory consumption testing aims at detecting places in the program, where too much memory is allocated. To find them, we will review the results in the memory-measuring view Memory Call Tree. You can also use the Memory Hot Spots view to locate places where too much memory is used.
During Application Initialization
We see that the main thread is first in memory consumption. It is the place where initiation of the system classes, used by the JVM for internal purposes, is performed. To see whether there is something from the demo source that contributes to memory consumption, we will unfold the main node until we reach a Memory Allocation (![]() ) sub-node.
) sub-node.
For better comprehension we may leave visible only entries consuming more than 1 KB by typing the filter "'>1024" at the top of the size column.
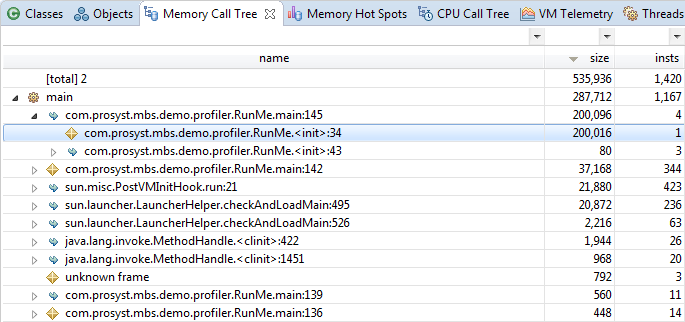
Sub-nodes on each level are also descendingly ordered by memory allocation, so the most memory consuming line will be located at the top of the level. We see that the line 34 in the initialization block of the RunMe class has allocated approximately 200KB. To get details on the objects behind these 200KB, right-click the code line in the view and use the Go to > Filter Objects. mBProfiler will open the Objects view showing that this piece of memory represents an array of int values.
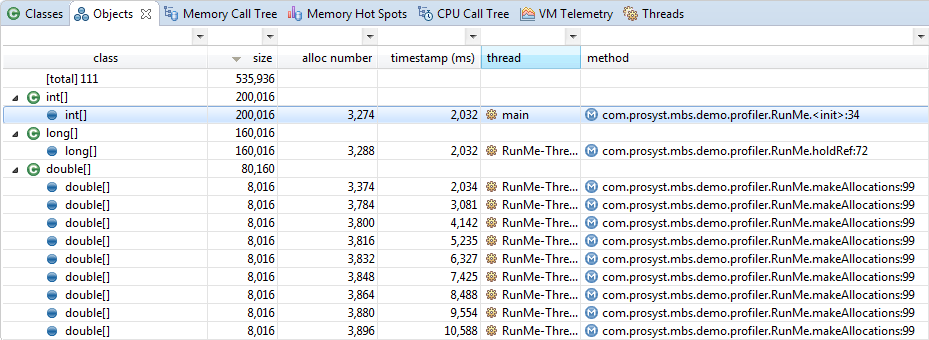
To locate the line of source code consuming the memory, right-click on the call line and select Show Source Line from the pop-up menu.
During Thread Execution
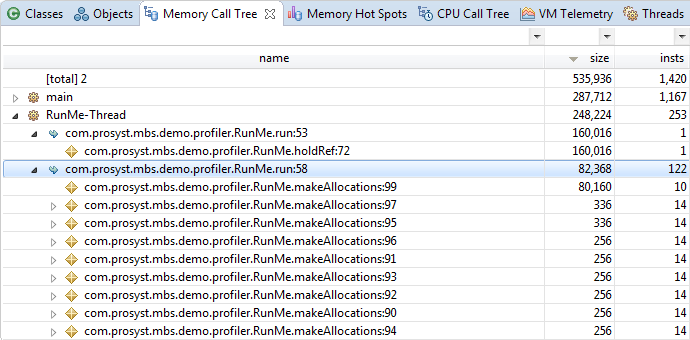
Following the same algorithm, we can find the most memory consuming line in the RunMe-Thread, from where the makeAllocations method is called. The method creates objects representing different data structures on each iteration. A method call to the makeAllocations method is situated on line 58. In addition, in the sixth iteration the method produces a memory leak by duplicating a double array.
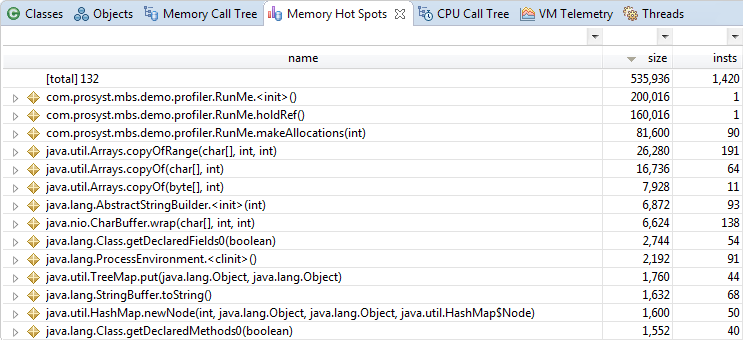
Locating Uncleaned Objects
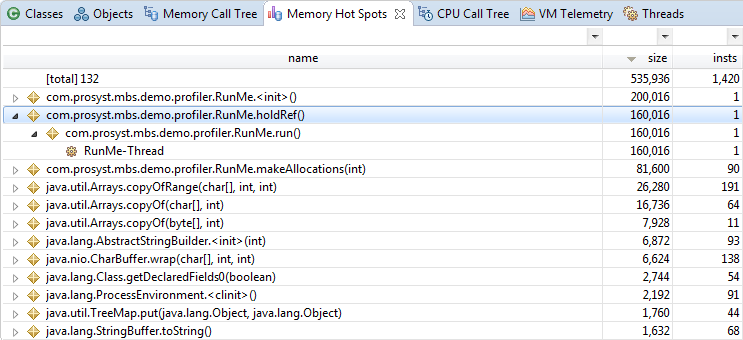
As previously discussed, the holdRef method invoked within the run method of RunMe-Thread leaves an uncleaned long array assigned to the long_array2 variable. To locate this spot, this time we'll use the Memory Hot Spots view. The view shows the methods whose execution has engaged most memory. As holdRef takes about 160KB, it is shown as one of the hottest spots:
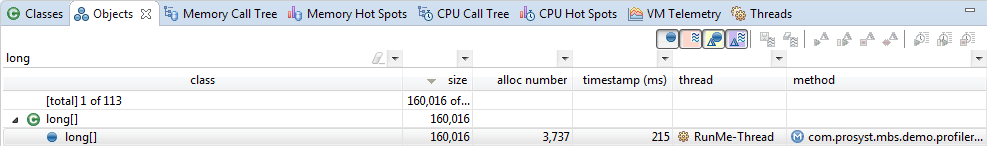
Then, to locate in the Objects view the big object behind the call, right-click the method line in the Memory Hot Spots view and select Go to > Filter Objects.
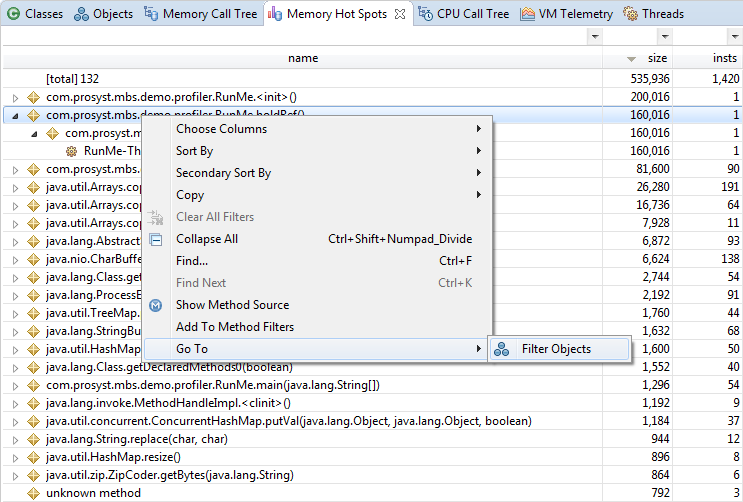
Executing the action will take you to the Objects view and the problematic long array.
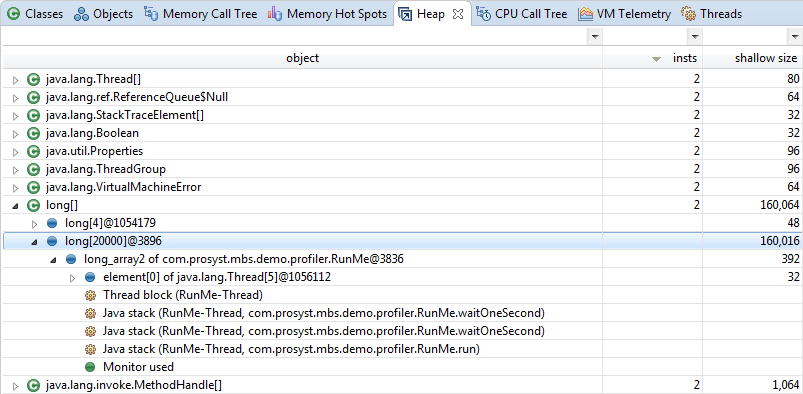
In case you have taken a snapshot of the heap during the demo execution (mBProfiler > View Heap Snapshot), another useful information can be the array place in the Java heap along with the entities referencing it. Right-click link containing the long array and select Go to > Find in Heap. The Heap view will be opened with the long array high-lighted. There you can see that the object is saved into the long_array2 variable.
CPU Consumption Analysis
CPU consumption is visualized mainly in the CPU Call Tree and CPU Hot Spots views. We'll focus on CPU Call Tree. The CPU Call Tree view is organized in a way similar to the Memory Call Tree one – the most consuming threads are listed before the others and the most CPU loading lines are on the top of each level. In order to be able to view the results you need to take a snapshot of the CPU Call Tree during the demo execution (mBProfiler > Start CPU Session).
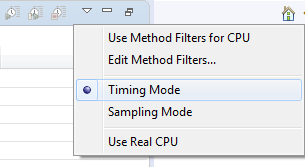
The mBProfiler can record the CPU consumption data in two different modes : Timing and Sampling. They can be switched via the ![]() button, which opens up the following drop down menu:
button, which opens up the following drop down menu:
As seen in the screenshot bellow (taken in Timing Mode) the most CPU consuming thread is RunMe-Thread and one of the lines that takes up most time for CPU operation is for the makeComputations method.
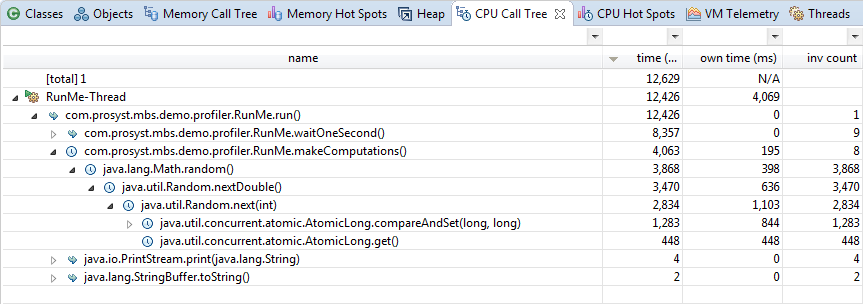
Right-click on the method execution line and select Show Method Source/Show Source Line (corresponding in Timing/Sampling mode as seen in the screenshot bellow) from the pop-up menu to locate the source of the makeComputations method.
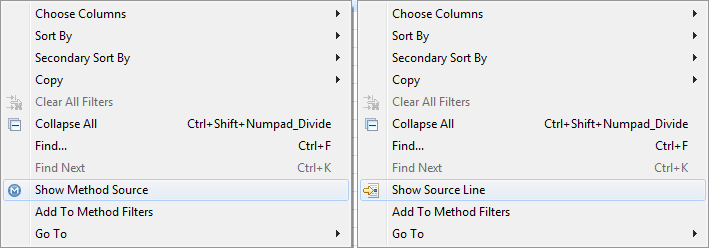
Keep in mind that in TIming mode – Show Method Source provides only method precision, while in Sampling mode – Show Source Line provides both method and line precision.