![]()
![]()
![]()
![]()
|
|
|
|
|
You can do this by starting a mark and mBProfiler will begin measuring the difference in memory consumption compared with the one that took place outside the mark. For example, you can measure the amount of the instances a certain operation creates. To do this, start a mark, then initiate the operation and mBProfiler will measure the differences in the memory consumption before the mark was started.
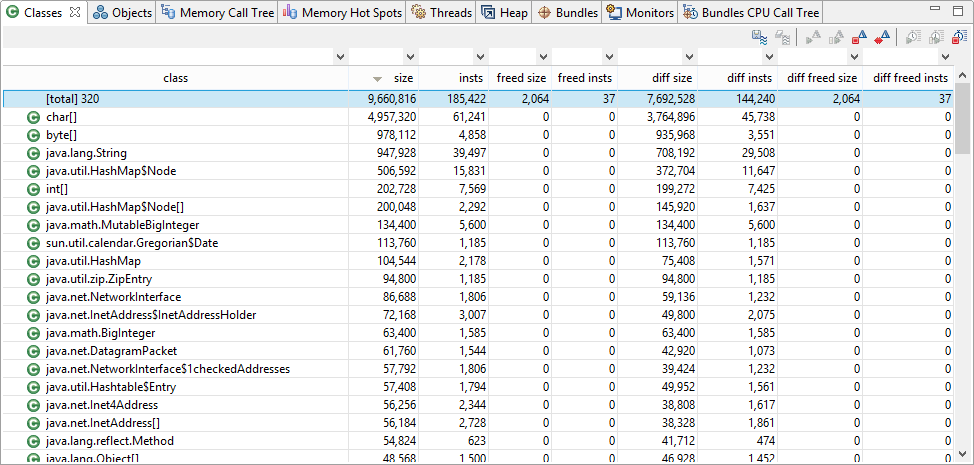
To start a mark, click the Start Mark (![]() ) toolbar option. The diff size, diff insts, diff freed size and diff freed insts columns in the Classes, Memory Call Tree and the Memory Hot Spots views will start to display the changes occurring in the measurements of the allocated objects:
) toolbar option. The diff size, diff insts, diff freed size and diff freed insts columns in the Classes, Memory Call Tree and the Memory Hot Spots views will start to display the changes occurring in the measurements of the allocated objects:
To clear the results without terminating the mark, click Reset Mark (![]() ). To end the currently observed period, click End Mark (
). To end the currently observed period, click End Mark (![]() ). The numbers displayed in the columns will not be cleared, so you'll still be able to see the latest results. If you want to continue the measurement, click Continue Mark (
). The numbers displayed in the columns will not be cleared, so you'll still be able to see the latest results. If you want to continue the measurement, click Continue Mark (![]() ). The changes occurring to objects will be added to the previous results (from the latest mark). If you want to restart the counting, click Start Mark again. The latest results will be cleared and the counting will start anew from the moment Start Mark (
). The changes occurring to objects will be added to the previous results (from the latest mark). If you want to restart the counting, click Start Mark again. The latest results will be cleared and the counting will start anew from the moment Start Mark (![]() ) is clicked.
) is clicked.