![]()
![]()
![]()
![]()
|
|
|
|
|
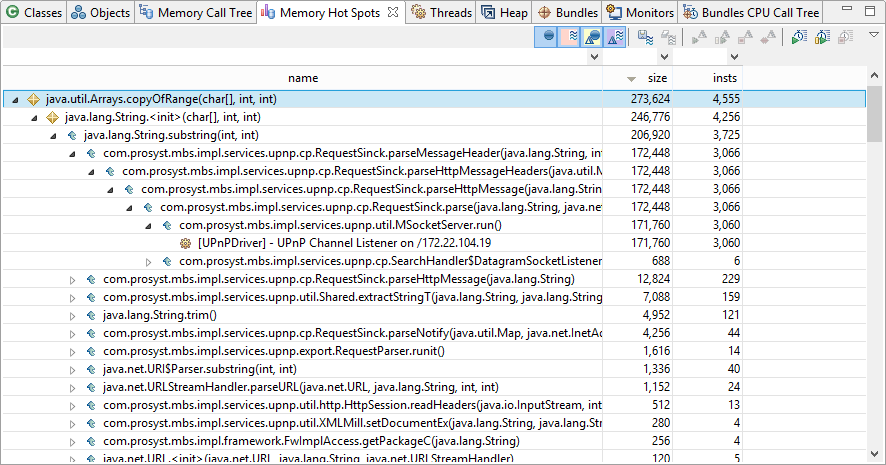
The Memory Hot Spots view displays the methods with the largest amount of allocated memory. The view provides the backtraces of methods as well.
The Memory Hot Spots view is not shown by default when launching mBProfiler in Eclipse. You can open the view by clicking Window > Show View > Memory Hot Spots from the main menu bar in the mBProfiler perspective.
To have data shown, memory profiling must be turned on and the session must be stopped – either from this view or from another one related to memory: Memory Call Tree, Classes, Objects or Bundles Memory Tree.
Call Backtraces
For each method execution, the Memory Hot Spots view shows the trace back to the originating thread, that is, in each method sub-tree the caller is a child of the callee. The tree nodes are similar to the Memory Call Tree ones but with reverse meaning.
Node |
Icon |
Description |
|---|---|---|
Memory Allocation |
|
Memory allocation nodes signify that there is allocated memory within the method body. All roots of the memory hot spots tree are of this node type. |
Follow Backtrace |
|
These nodes show calls that are on a lower level in the backtrace and do not allocate memory, but make other calls that do. |
Thread |
|
Each thread ends a sub-tree representing a method backtrace. Thread nodes give information about the thread name, the amount of memory allocated and the number of instances created within this call path. |
Memory Table and Filters
The information provided for each hot spot backtrace is arranged in table columns. Show/hide columns by using the Change Columns option from the popup menu or from mBProfiler preferences.
Columns |
Description |
|---|---|
class |
Contains the name of the class to which the method/frame belongs. If the package column is shown, this column shows only the class name. If the package column is hidden and the Show qualified name mBProfiler preference is on, this column contains the fully-classified class name. If there are several method calls on the same object type created from different loaders in a profiled OSGi runtime, e.g. if a bundle is re-installed a few times, mBProfiler will add sequence numbers next to the symbolic name of repeating nodes, e.g. my.bundle.Demo (2). |
package |
Holds the package to which the class belongs. If not shown, its value is added to the class column. |
class loader |
Shows the name of the class loader, which has loaded the class owning the method/frame.
|
size |
Gives the total number of bytes that the objects, created by the method/frame, currently allocate in the memory. |
insts |
Shows how many objects the method/frame have created. |
freed size |
Gives the total number of bytes initially allocated by the method and then freed by the garbage collector. Freed bytes are calculated only for the rooting hot spot. |
freed insts |
Shows the number of freed objects since the beginning of the memory profiling. Freed instance count is calculated only for the rooting hot spot. |
diff size diff insts diff freed size diff freed insts |
Allows you to estimate the exact memory consumption of a hot spot that takes place within a certain period of time during the application operation. These columns provide information about the changes in the size, number of objects or number of freed objects in a given hot spot during a marked execution period. If there is no period marked, the shown difference is zero |
You can also observe more precisely the hot spots within a period of time by using marks – see Marking an Observation Period.
You can also filter the information shown in the table so that you can locate spots of specific consumption.
In addition, you can sort conveniently memory data as described in the Table Sorting section.
Locating the Objects Allocated by a Method Execution
You can quickly view the objects created by a memory hot spot. Right-click on a line within the relevant method tree and select Go to > Filter Objects from the pop-up menu. As a result, the Objects view will open showing the objects related to the hot spot in the following way:
Let's have a hot spot A which roots the A -> B -> C sequence of stack frames or method calls. Using Go to > Filter Objects on the hot spot A will result in viewing the objects produced in the source of the whole hot spot's backtrace. Using Go to > Filter Objects on node C will make visible only the objects generated after the C -> B -> A sequence is executed.
Getting CPU Consumption of a Hot Spot
To examine the hot spot with regard to CPU usage, right-click the line within the relevant call stack and select Go to > Find In CPU Hot Spots. The CPU Hot Spots view will show up with the entry selected in the relevant backtrace.
Getting Information about the Activity of a Thread
To easily get runtime information about the activity of a thread from the Memory Hot Spots view, right-click the thread node of interest at the bottom of the backtrace and select Go to > Find in Threads. mBProfiler will switch you to the Threads view with the information about the target thread highlighted. The Threads view will offer details about the activity events of the thread.
Locating the Call Stack of a Thread
To quickly locate the analogous top-to-bottom call stack from the Memory Hot Spots view into the Memory Call Tree one, right-click the thread node of interest at the bottom of the backtrace and select Go to > Find in Memory Call Tree. The Memory Call Tree view will open with the thread root node high-lighted.
If you are profiling an OSGi runtime, by using the Go to > Find in Bundles Memory Call Tree you can quickly switch to the Bundles Memory Call Tree view and locate the corresponding thread's call stack there.
Excluding Method Calls from Results
By means of exclude method filters the Memory Hot Spots view supports narrowing the amount of profiling data so that only most useful information remains visible. The options to introduce and apply such filters are the same as in the Memory Call Tree view.