mBProfiler aids developers in improving the efficiency of applications. It is oriented towards testing and exploring different aspects of the performance of a Java program, concerning the operation of the JVM making use of available platform resources.
Product efficiency is achieved by detecting hot spots and bottle necks and reducing their memory and resource consumption.
mBProfiler is built in pure Java, which makes it totally compliant with programs written in Java. In the same time it possesses all the advantages of the Java language – it is platform independent and robust, provides garbage collection and security.
Functionality
mBProfiler provides the following functionality:
Memory consumption measurement
Memory stack frames tracing
CPU loads profiling
Momentary heap allocation information
Thread state progress statistics
Visual representation of VM work loads by different parameters
Tracking the stack traces of the active threads and the monitors they use.
Source code reference
Garbage collection during profiling
Remote profiling
Profiling only of a particular stage or a combination of several stages of the program life cycle
Using different target environments
Saving the profiling information for further examination
Exporting the profiling information in text or XML format
Headless run
Functional Model
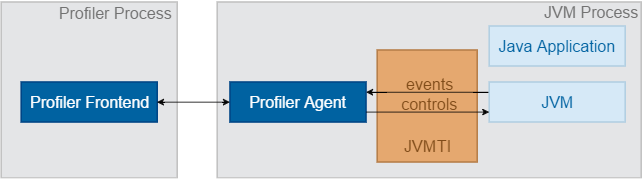
mBProfiler is built upon two components:
mBProfiler Agent – An in-process shared library that communicates with the JVM through a two-way function call interface – JVMTI (JavaTM Virtual Machine Tool Interface) for J2SE 6 or later. On one hand, the JVM notifies the Profiler Agent of various events, corresponding to, for instance, heap allocation, thread start, etc. On the other hand, the Profiler Agent issues control messages and requests for more information through the JVMTI. The JVMTI is a paradigm, introduced by Sun Microsystems (Now Oracle), which is an inseparable part of most of the JVMs available on the market. For details on JVMTI, please refer to its online documentation.
Profiler Frontend – An Eclipse plugin that presents the results collected by the Profiler Agent transmitted via wire protocol. The Profiler Frontend cannot run in the same process as the Profiler Agent. It resides in a different process on the same machine or on a remote machine connected via the network.
One of the greatest advantages of mBProfiler over other profiler tools is its suitability for thin devices such as boards, PDAs, and others. This includes two aspects:
Small memory footprint created by the Profiler Agent – less than 1 MB. This makes it especially suitable for low-memory devices.
Support of miscellaneous kinds of JVMs, such as Aonix Perc® Ultra, Skelmir CEE-J® VM, etc. Most of the other available profiler tools support only Oracle JDK, which is not suitable for thin devices.
OSGi Support
mBProfiler Agent is integrated in the OSGi runtime of the SDK. With agent's help, you can start the OSGi Runtime in remote profiling mode and take advantage of all the mBProfiler's features to collect and examine data on runtime's performance. Additionally, the mBProfiler frontend provides convenient views in Eclipse that allow you to monitor the memory and CPU load for each bundle currently available in the OSGi environment.
Requirements
To run properly, mBProfiler needs the Profiler Agent for the hosting OS, which is available as the following native library:
Windows: proft.dll for JVMTI.
Linux: libproft.so for JVMTI.
OS X: libproft.jnilib or libproft.dylib for JVMTI.
They are all located in the <eclipse_home_dir>/dropins/mBProfiler/agents installation directory of mBProfiler. There are also Profiler Agents for the different types of processors in the same directory.
The JVM liable to profiling must support the JVMTI interface. JVMTI was introduced at JDK 5.0. JVMTI replaces JVMPI which, as of JDK 6, is no longer provided.
For details on the supported JVMs and OSes for each processor type, please refer to the "List of Supported JVMs, OSes and Architectures for Profiling" document.
Known Issues and Limitations
On Mac OS X 10.11 (OS X El Capitan) and greater System Integrity Protection disables native agent loading from JVM. System Integrity Protection has to be disabled or -agentpath JVM option has to be used manually.
If com.prosyst.mbs.mbprofiler.bcm.jar is not found, JVM crashes. Refer to ORACLE Java Bug Dabase.
Oracle JDK version 1.3 to 11 – No sleeping state of threads in threads pane, no stack traces in monitor dumps.
Skelmir CEE-J – WAIT looks like SLEEP, actual SLEEP is not sent, no threads status in monitor dump, no class loader information.
PERC – No sleeping state of threads in threads pane, no class loader information, monitor dump does not work, toString does not work.