![]()
![]()
![]()
![]()
|
|
|
|
|
By means of special views, mBProfiler shows profiling data classified by each bundle running in the OSGi environment. You can view the following "per-bundle" performance information:
This information will become available in three special views – Bundles, Bundles Memory Call Tree and Bundles CPU Call Tree, as soon as the OSGi runtime successfully connects with the mBProfiler in a remote session.
Launching an OSGi Runtime for Profiling with mBProfiler
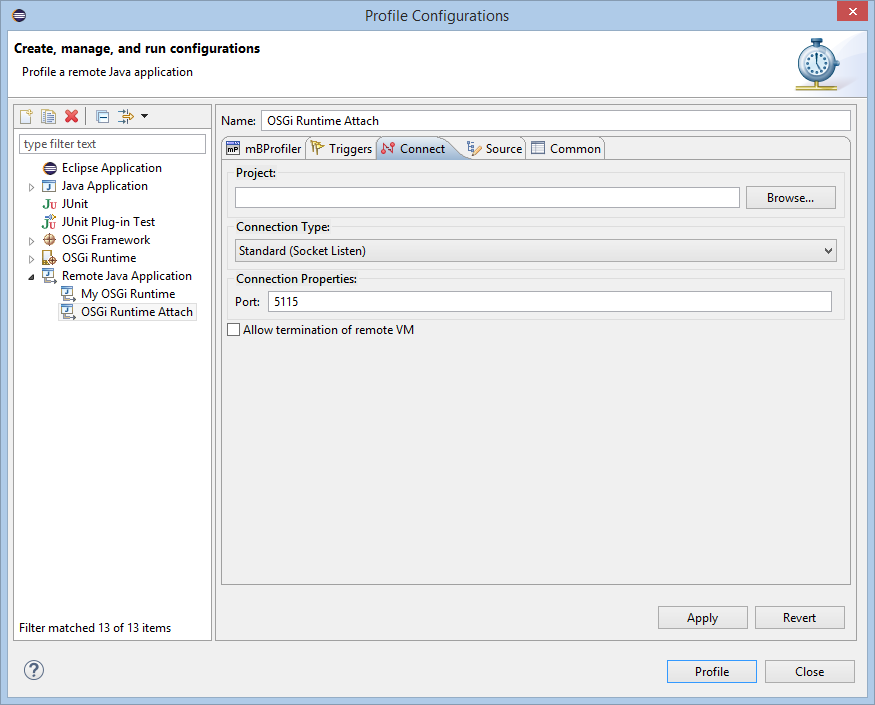
In Listening Mode
To run the OSGi runtime for remote profiling with mBProfiler with the runtime listening for a request from the Profiler Frontend:
server profiler [jvmti] [suspend] [port <port_number>]
By default, the JVM will complete its startup and then will start listening for requests from the mBProfiler. When such a request arrives, it will then send profiling information to the frontend.
If the JVM of the runtime support JVMTI, include the jvmti option in the command line.
Use the suspend option to start the JVM in "suspended" profiling mode – it will not commence its execution until mBProfiler connects to it. Thus, you can evaluate the performance of the OSGi environment during its startup as well.
By default, the JVM is configured to listen for mBProfiler requests on port 5115. If the port for profiling should be changed, use the port <port_number> additional option.
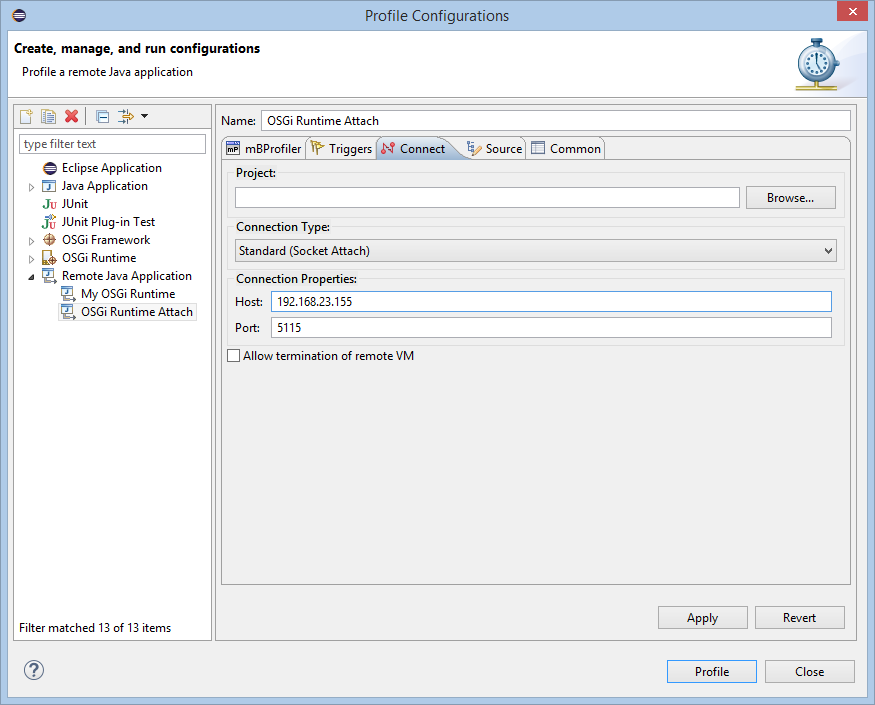
In Attaching Mode
To run the OSGi runtime for remote profiling with mBProfiler with the runtime attaching to the Profiler Frontend:
server profiler attach [jvmti] [port <frontend_host>:<port_number>]
By default, the JVM is configured to send requests to the frontend running on the same host and using port 5115. If the host and/or port for profiling should be changed, use the port <frontend_host>:<port_number> additional option.
If the JVM of the runtime support JVMTI, include the jvmti option in the command line.
Launching an OSGi Platform from within Eclipse
In case you have installed the Eclipse plug-ins of the OSGi SDK, it is also possible to launch in profiling mode a local OSGi emulation or an already running remote one by using an OSGi Runtime profile launch configuration. Refer to the mToolkit User Guide > OSGi Emulator and mToolkit User Guide > OSGi Remote Launcher in the Eclipse help for more information about starting the OSGi platform in this way.