![]()
![]()
![]()
![]()
|
|
|
|
|
In the Monitors view mBProfiler gives the opportunity to track the stack traces of the currently active threads and the monitors they hold. Thus, you can easily locate the monitors owned by a thread or the monitors a thread is waiting on and also determine the exact location of and reasons for a deadlock.
The Monitors view is not shown by default when launching mBProfiler in Eclipse. You can explicitly open the view by clicking Window > Show View > Monitors from the main menu bar in the mBProfiler perspective.
To display monitors profiling data, click the ![]() workbench toolbar button or use mBProfiler > View Monitors Snapshot from the menu bar. The Monitors view will appear. To easily refresh thread monitors, use the
workbench toolbar button or use mBProfiler > View Monitors Snapshot from the menu bar. The Monitors view will appear. To easily refresh thread monitors, use the ![]() button.
button.
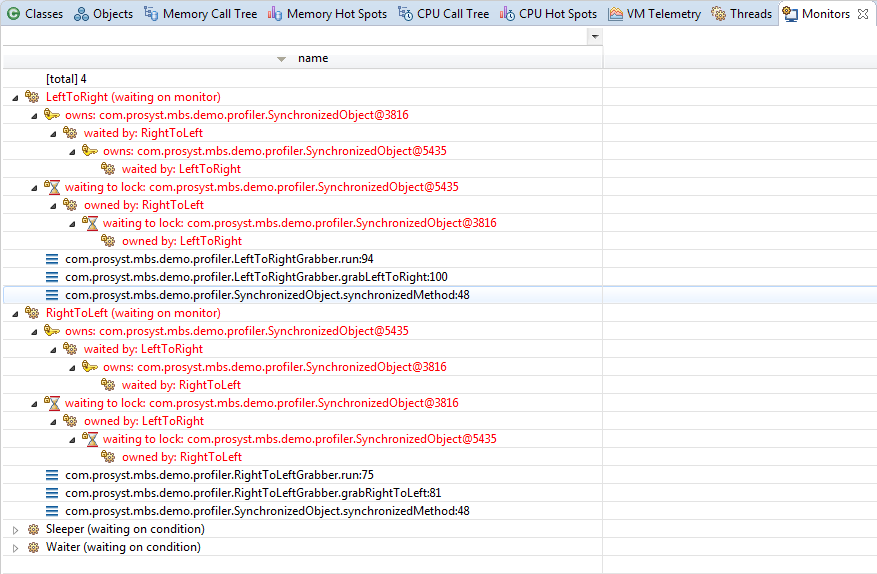
The profiling information on the available monitors is represented in a tree. Nodes coloured in read indicate a deadlock. The types of tree nodes are as follows:
Node |
Icon |
Description |
|---|---|---|
Thread |
|
The thread node, which roots a sub-tree representing its call stack. |
Call stack |
|
The stack trace of the thread at the moment of taking the monitors snapshot. |
Deadlocked thread |
|
A deadly locked thread. |
Owned monitor |
|
A monitor owned by its parent thread. |
Deadlocked own monitor |
|
A deadly locked monitor owned by its parent thread. |
Thread waiting for a monitor |
|
A monitor that its parent thread is waiting on. |
Thread waiting for a deadlocked monitor |
|
A deadly locked monitor that its parent thread is waiting on. |
If profiling through JVMTI, the JVM returns the list of owned monitors but without indicating the existence and number of duplicates. Therefore, mBProfiler cannot show if a monitor is locked more than once.
Getting Information about the Activity of a Thread
To easily get runtime information about the activity of a thread rooting a monitor sequence from the Monitors view, right-click the thread node of interest and select Go to > Find in Threads. mBProfiler will switch you to the Threads view with the information about the target thread highlighted. The Threads view will offer details about the activity events of the thread as well. For more information about thread profiling data, refer to the Monitoring Thread Activity guide.
Locating the Object Entry for a Monitor
To locate a monitor in the Objects view so as to examine its properties such as size and allocation number, timestamp, thread and method, right-click the monitor node and use Go to > Find in Objects.