![]()
![]()
![]()
![]()
|
|
|
|
|
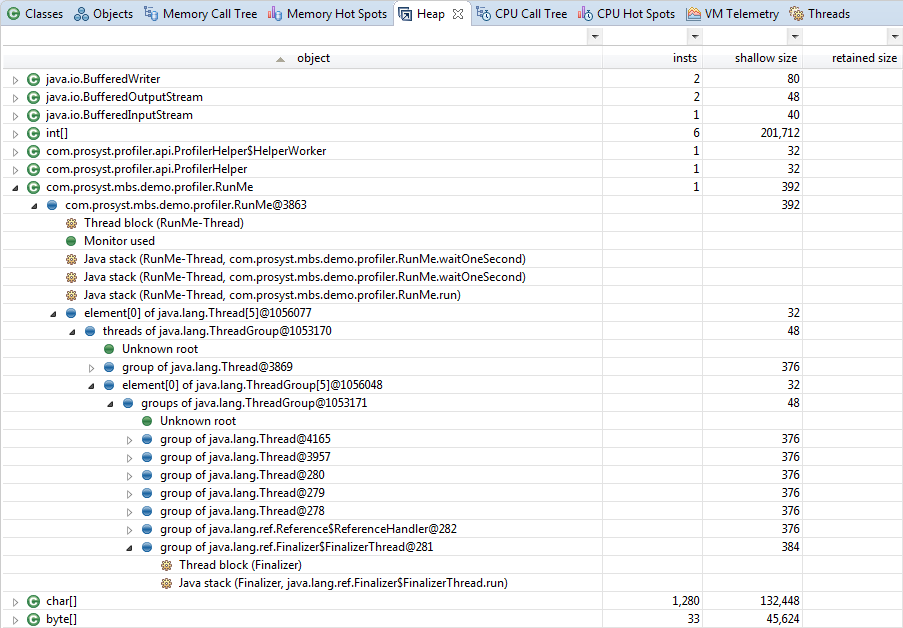
The Heap view shows information about each object currently present in the memory heap.
The Heap view is not shown by default when launching mBProfiler in Eclipse. You can explicitly open the view by clicking Window > Show View > Heap from the main menu bar in the mBProfiler perspective.
When profiling a JVM through JVMTI, to see useful heap dump you must run a memory profiling session as well.
To take a heap snapshot, press the ![]() button on the workbench toolbar. The Heap view will appear. To obtain a Heap Snapshot go to mBProfiler > View Heap Snapshot. To refresh the information about the heap, use the
button on the workbench toolbar. The Heap view will appear. To obtain a Heap Snapshot go to mBProfiler > View Heap Snapshot. To refresh the information about the heap, use the ![]() button.
button.
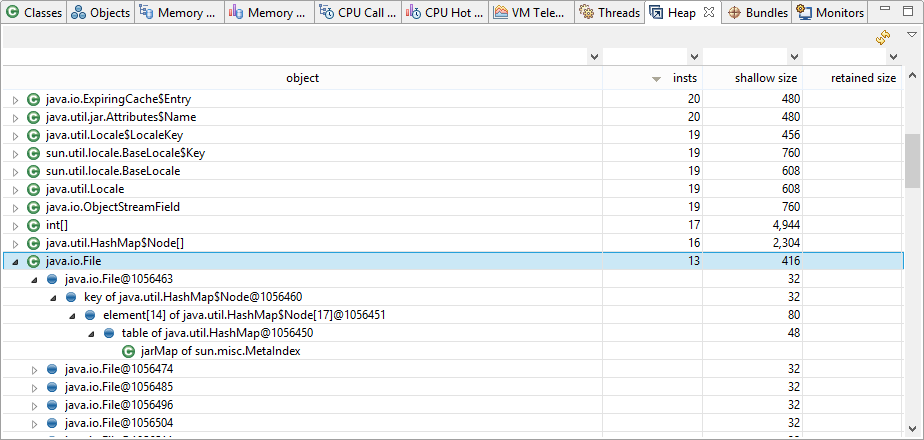
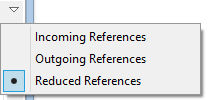
The object column shows a tree holding all allocated instances grouped according to their classes. Each node representing an allocated instance roots a subtree of the references related to this instance. The references can be incoming, outgoing and reduced. By default, the incoming references are shown. To change the displayed reference type, use the pull down menu of the Heap view:
The tree in the object column can have the following nodes:
Nodes |
Icon |
Description |
|---|---|---|
System class/ Static field |
|
A node holding all allocated instances of the corresponding class. In the incoming references, it also stands for a static field, which is referencing the object of the parent node. |
Instance/ Referencing/ Referenced |
|
An instance of a class. Its subnodes represent the following:
|
Leaf node |
|
This node can represent:
|
Reference loop |
|
Node, already listed up in the references tree. |
Static field |
|
Outgoing references only. Roots all references from static fields of the class. |
Thread |
|
A thread. It can represent the following:
|
The Heap Table
The rest of the columns in the heap table represent the following information:
Columns |
Description |
|---|---|
insts |
The number of instances of the relevant class that are currently created |
package |
The package to which the object belongs. If not shown, its value will be added to the object column. |
class loader |
The distinguish name of the class loader, which has loaded the correspondent class.
|
shallow size |
The size of the selected object. |
retained size |
The shallow size of the selected object plus the shallow size of all its direct and indirect references. It can be calculated for each object by calling the Calculate Retained Size command from the popup menu. |
You can filter the information in the table, thus concentrating only on a certain set of data. For details, refer to the Filtering the Profiling Data section.
Viewing Incoming References
When the incoming option is chosen, you will be able to see all the references made towards a particular instance:
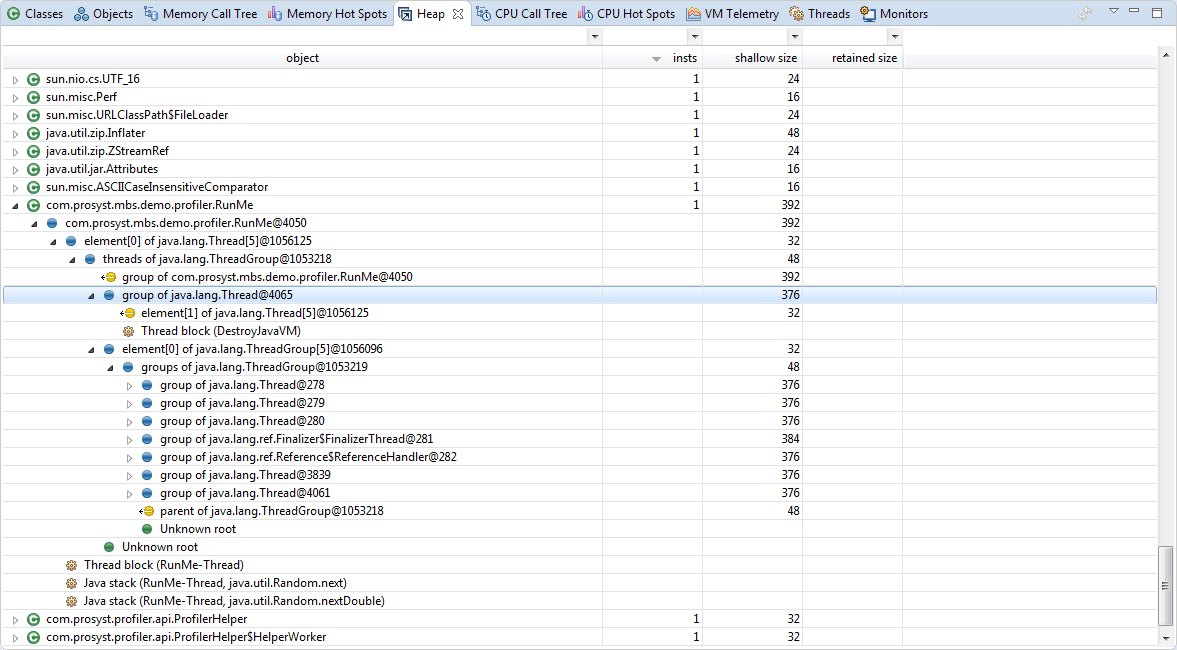
A sub-node has the following format:
Name |
Class |
ID |
|---|---|---|
threads of |
ThreadGrouop@ |
5105936 |
Viewing Outgoing References
The outgoing option will rearrange the subtree of each instance node according to the references this instance makes towards the other instances.
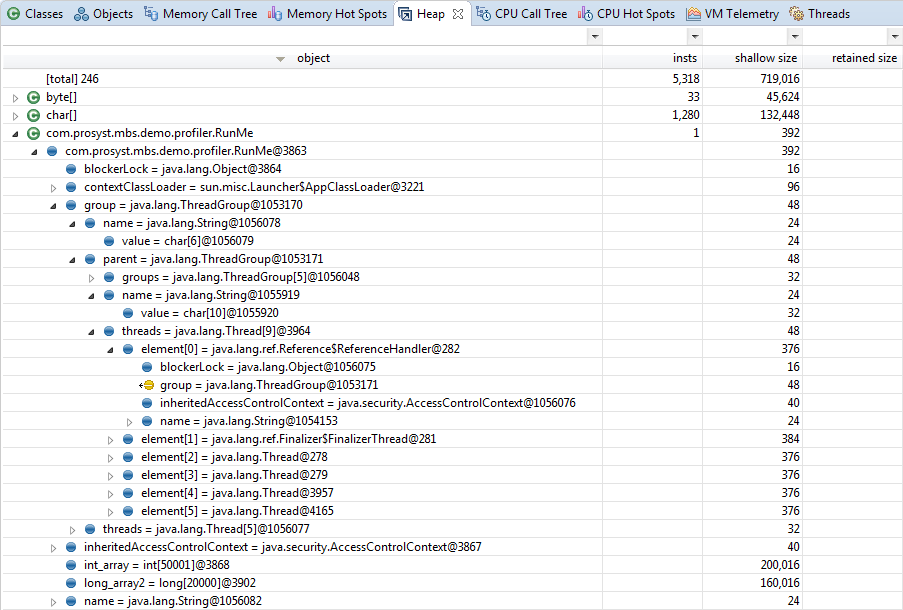
The format of the sub-nodes is the following:
Name |
Class |
ID |
|---|---|---|
pdcache = |
HashMap@ |
51145944 |
Viewing Reduced References
The reduced option displays the shortest path of incoming references from a GC root:
Finding Information about the Instances of a Class
For a class you can check in the Classes view the resources spent for creating its instances. In the Heap view right-click the class root node and select Go to > Find in Classes from the pop-up menu.
Analyzing the Object Details about a Reference
For a reference node in the heap, allocated while the memory profiling session has been running, you can check the details available about the object behind it in the Objects view. Right-click the node and select Go to > Find in Objects from the pop-up menu. You cannot use this option for references, created in the heap while memory profiling has been off.
Locating the Allocations for a Class in the Memory Call Tree
You can filter the Memory Call Tree so as to show only the allocation of a class's instances. Stop the memory profiling, right-click the reference node and select Go to > Filter Memory Call Tree from the pop-up menu.
Locating an Instance for a Reference in the Heap
You can easily spot and analyze in detail the instance that is referencing/being referenced in a heap allocation sub-tree. Right-click the reference node and Go to > Find in Heap from the pop-up menu. As a result, mBProfiler will spot the instance references sub-tree in the heap.