![]()
![]()
![]()
![]()
|
|
|
|
|
To have data shown, memory profiling must be turned on – either from this view or from another one related to memory – Memory Call Tree, Objects, Memory Hot Spots or Bundles Memory Call Tree. Class information is regularly updated without the need of stopping memory profiling.
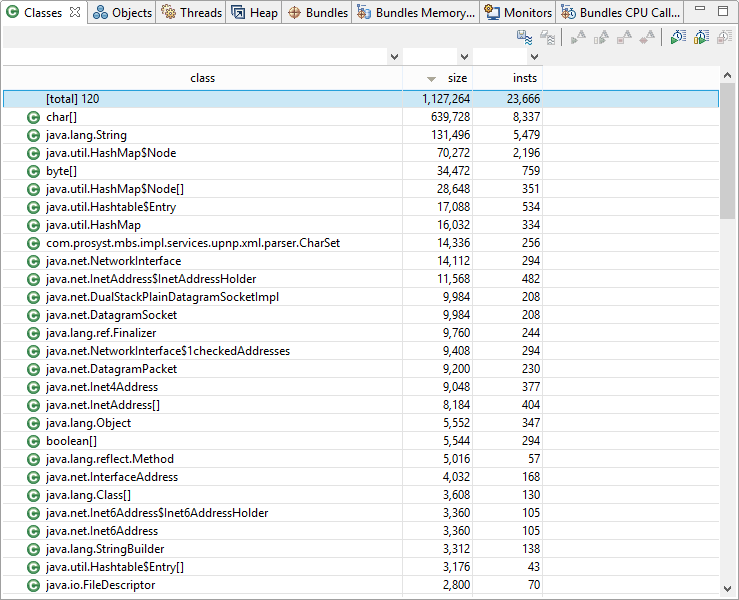
The information provided for each class instance is arranged in table columns. You can add and remove columns from the mBProfiler's preferences, accessible from the Choose Columns options of the popup menu or from the the mBProfiler preferences. Go to Window >Preferences (or Eclipse >Preferences if you are using OS X) and then to mBProfiler > Columns.
Parameter |
Description |
|---|---|
class |
Contains the name of the class. If the package column is shown, this column shows only the class name. If the package column is hidden and the Show qualified names mBProfiler preference is on, this column contains the fully-classified class name. If there are several Class objects with the same name created from different loaders in a profiled OSGi runtime, e.g. if a bundle is re-installed a few times, mBProfiler will add sequence numbers next to the symbolic name of repeating nodes, e.g. my.bundle.Demo (2). |
package |
Holds the package to which the class belongs. If not shown, its value is added to the class column. |
class loader |
Shows the name of the class loader, which has loaded the correspondent class.
|
size |
Gives the total number of bytes that the corresponding class instances currently have allocated in the memory. |
insts |
Shows how many instances of the class have been created. |
freed size |
Gives the total number of freed bytes of the corresponding class freed instances. |
freed insts |
Shows the number of freed instances since the beginning of the memory profiling. |
diff size diff insts diff freed size diff freed insts |
Allows you to estimate the exact memory consumption that takes place within a certain period of time during the application operation. These columns provide information about the changes in the size, number of instances or number of freed instances of a given object type during a marked execution period. If there is no period marked, the shown difference is zero (refer to Marking an Observation Period). |
You can also filter the information shown in the table so that you can locate spots of specific consumption.
In addition, you can sort conveniently per-class memory data as described in the Table Sorting section.
Keeping and Clearing the Temporary Objects
To keep the temporary objects cleared by the garbage collector, use the ![]() button from the view toolbar. If checked, the temporary objects will be virtually stored in the mBProfiler's frontend so that you can examine their amount and type. To clear them, click the
button from the view toolbar. If checked, the temporary objects will be virtually stored in the mBProfiler's frontend so that you can examine their amount and type. To clear them, click the ![]() view toolbar button.
view toolbar button.
Getting Details about the Instances of a Class
To easily find and examine separately the instances of a specific class, double-click on the class row, or right-click on the class and select Go to > Find In Objects from the popup menu. As a result, the Objects view will open high-lighting the class and its instance sub-tree.
Locating Class Instances in the Heap
To easily find the allocation for the instances of a specific class in the heap, right-click on the class and select from the popup menu:
The Heap view will be shown with the allocation the sub-tree for the class high-lighted and expanded.
Filtering Allocations of Class Instances in the Call Tree
You can quickly make the call tree show only the spots where the instances of a class are allocated. Stop memory profiling, in the Classes view right-click the class and select Go to > Filter Memory Call Tree. The Memory Call Tree will open showing only the call stacks where allocations of the selected class exist.