![]()
![]()
![]()
![]()
|
|
|
|
|
The Memory Call Tree view represents the call stacks and the amount of the objects created during program execution. The direct sub-nodes of each node in the tree are descendingly arranged by their memory consumption.
The Memory Call Tree view is not shown by default when launching mBProfiler in Eclipse. You can open the view by clicking Window > Show View > Memory Call Tree from the main menu bar in the mBProfiler perspective.
To have data shown, memory profiling must be turned on and the session must be stopped – either from this view or from another one related to memory: Memory Hot Spots, Classes,Objects or Bundles Memory Call Tree.
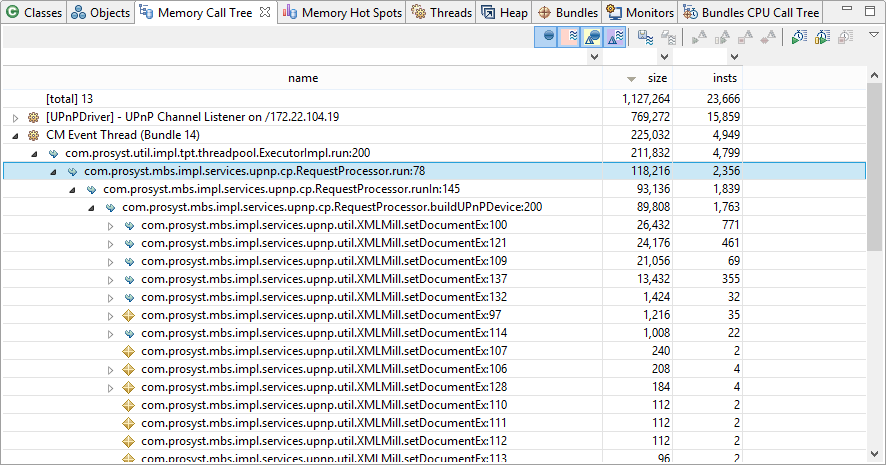
Memory Tree
There are the following types of nodes:
Node |
Icon |
Description |
|---|---|---|
Thread |
|
Each thread starts a subtree representing its memory stack. The direct sub-nodes are the call stacks it has initiated. Thread nodes give information about the thread name, the amount of memory allocated during their life cycle and the number of instances created. |
Memory Allocation |
|
Memory allocation nodes signify that there is allocated memory on the corresponding line of the source code. All leaves of the memory tree are this type of nodes. |
Follow Stack |
|
These nodes show calls that are on a higher level in the stack trace and do not allocate memory, but make other calls that do. |
Each node that roots a sub-tree shows the total instances and memory taken by the correspondent method and all of its successor nodes. A node that is just a method call and does not allocate any memory, shows the number of instances and the amount of memory occupied by its sub-nodes. If a node does allocate memory, the instances it makes and the memory it occupies are added to the whole sum of instances and memory occupied so far by its sub-nodes.
The names of the sub-nodes of a thread give the following information:
Class |
Method |
Line |
|---|---|---|
java.util.Hashtable. |
getEnumeration: |
547 |
Memory Table and Filters
The information provided for each call stack is arranged in table columns. Show/hide columns by using the Change Columns option from the pop-up menu or from mBProfiler preferences.
Parameter |
Description |
|---|---|
class |
Contains the name of the class to which the method/frame belongs. If the package column is shown, this column shows only the class name. If the package column is hidden and the Show qualified names mBProfiler preference is on, this column contains the fully-classified class name. If there are several calls of a method on the same object type created from different loaders in a profiled OSGi runtime, e.g. if a bundle is re-installed a few times, mBProfiler will add sequence numbers next to the symbolic name of repeating nodes, e.g. my.bundle.Demo (2). |
package |
Holds the package to which the class belongs. If not shown, its value is added to the class column. |
class loader |
Shows the name of the class loader, which has loaded the class owning the method/frame.
|
size |
Gives the total number of bytes that the objects, created by the method/frame, currently allocate in the memory. |
insts |
Shows how many objects the method/frame have created. |
freed size |
Gives the total number of bytes initially allocated by the method and then freed by the garbage collector. Freed bytes are calculated only for the rooting thread. |
freed insts |
Shows the number of freed objects since the beginning of the memory profiling. Freed instance count is calculated only for the rooting thread. |
diff size diff insts diff freed size diff freed insts |
Allows you to estimate the exact memory consumption of a thread that takes place within a certain period of time during the application operation. These columns provide information about the changes in the size, number of objects or number of freed objects in a given hot spot during a marked execution period. If there is no period marked, the shown difference is zero (see Marking an Observation Period). |
You can also observe more precisely the call stacks within a period of time by using marks.
You can filter the displayed information, thus concentrating only on a certain set of data.
Locating the Objects Allocated by a Method Execution
You can quickly view the objects created by a method call. Right-click on a line within the relevant call stack and select Go to > Filter Objects from the pop-up menu. As a result, the Objects view will open showing only the objects related to the entry.
Getting Information about a Hot Spot
To easily evaluate a memory hot spot, and its backtrace in particular, right-click the Memory Allocation (![]() ) node of interest and use Go to > Find in Memory Hot Spots. The Memory Hot Spots view will show up with the selected entry as a hot spot root node.
) node of interest and use Go to > Find in Memory Hot Spots. The Memory Hot Spots view will show up with the selected entry as a hot spot root node.
Locating CPU Information about a Method Execution
To check the time, invocation count and other data related to CPU consumption, right-click the line within the relevant call stack and select Go to > Find In CPU Call Tree. The CPU Call Tree view will show up with the selected entry in the call stack.
Getting Information about the Activity of a Thread
To easily get runtime information about the activity of a thread from the Memory Call Tree view, right-click the thread root node of interest and select Go to > Find in Threads. mBProfiler will switch you to Threads view with the information about the target thread highlighted. The Threads view will offer details about the activity events of the thread.
Tracing an Allocation within an OSGi Environment
If you are profiling an OSGi runtime, you can easily find which bundle is the source of a method call or a frame from a thread's call stack from the Memory Call Tree. Right-click the entry in the call tree and use Go to > Find in Bundles Memory Call Tree from the pop-up menu. The Bundles Memory Call Tree view will show up with the involved bundle selected.
Excluding Method Calls from Results
In certain cases, having common method calls like wait of Object or sleep of Thread included in the call tree might increase unnecessarily the amount of shown profiling data and might trouble performance analysis. You can hide such method calls from the Memory Call Tree view with the help of the exclude method filters: